PNC Bank 2015 Annual Report Download - page 206
Download and view the complete annual report
Please find page 206 of the 2015 PNC Bank annual report below. You can navigate through the pages in the report by either clicking on the pages listed below, or by using the keyword search tool below to find specific information within the annual report.-
 1
1 -
2
-
3
-
4
-
5
-
6
-
7
-
8
-
9
-
10
-
11
-
12
-
13
-
14
-
15
-
16
-
17
-
18
-
19
-
20
-
21
-
22
-
23
-
24
-
25
-
26
-
27
-
28
-
29
-
30
-
31
-
32
-
33
-
34
-
35
-
36
-
37
-
38
-
39
-
40
-
41
-
42
-
43
-
44
-
45
-
46
-
47
-
48
-
49
-
50
-
51
-
52
-
53
-
54
-
55
-
56
-
57
-
58
-
59
-
60
-
61
-
62
-
63
-
64
-
65
-
66
-
67
-
68
-
69
-
70
-
71
-
72
-
73
-
74
-
75
-
76
-
77
-
78
-
79
-
80
-
81
-
82
-
83
-
84
-
85
-
86
-
87
-
88
-
89
-
90
-
91
-
92
-
93
-
94
-
95
-
96
-
97
-
98
-
99
-
100
-
101
-
102
-
103
-
104
-
105
-
106
-
107
-
108
-
109
-
110
-
111
-
112
-
113
-
114
-
115
-
116
-
117
-
118
-
119
-
120
-
121
-
122
-
123
-
124
-
125
-
126
-
127
-
128
-
129
-
130
-
131
-
132
-
133
-
134
-
135
-
136
-
137
-
138
-
139
-
140
-
141
-
142
-
143
-
144
-
145
-
146
-
147
-
148
-
149
-
150
-
151
-
152
-
153
-
154
-
155
-
156
-
157
-
158
-
159
-
160
-
161
-
162
-
163
-
164
-
165
-
166
-
167
-
168
-
169
-
170
-
171
-
172
-
173
-
174
-
175
-
176
-
177
-
178
-
179
-
180
-
181
-
182
-
183
-
184
-
185
-
186
-
187
-
188
-
189
-
190
-
191
-
192
-
193
-
194
-
195
-
 196
196 -
 197
197 -
 198
198 -
 199
199 -
 200
200 -
 201
201 -
 202
202 -
 203
203 -
 204
204 -
 205
205 -
 206
206 -
 207
207 -
 208
208 -
 209
209 -
 210
210 -
 211
211 -
 212
212 -
 213
213 -
 214
214 -
 215
215 -
 216
216 -
217
-
218
-
219
-
220
-
221
-
222
-
223
-
224
-
225
-
226
-
227
-
228
-
229
-
230
-
231
-
232
-
233
-
234
-
235
-
236
-
237
-
238
-
239
-
240
-
241
-
242
-
243
-
244
-
245
-
246
-
247
-
248
-
249
-
250
-
251
-
252
-
253
-
254
-
255
-
256
 |
 |

N
OTE
15 E
ARNINGS
P
ER
S
HARE
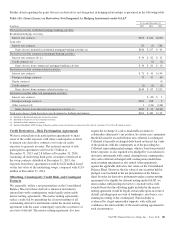
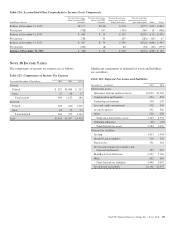
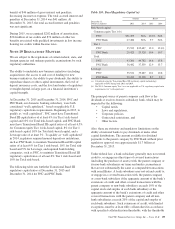
Table 118: Basic and Diluted Earnings per Common Share
In millions, except per share data 2015 2014 2013
Basic
Net income $4,143 $4,207 $4,212
Less:
Net income (loss) attributable to noncontrolling interests 37 23 11
Preferred stock dividends and discount accretion and redemptions 225 237 249
Net income attributable to common shares 3,881 3,947 3,952
Less:
Dividends and undistributed earnings allocated to participating securities 17 11 18
Net income attributable to basic common shares $3,864 $3,936 $3,934
Basic weighted-average common shares outstanding 514 529 528
Basic earnings per common share (a) $ 7.52 $ 7.44 $ 7.45
Diluted
Net income attributable to basic common shares $3,864 $3,936 $3,934
Less: Impact of BlackRock earnings per share dilution 18 18 18
Net income attributable to diluted common shares $3,846 $3,918 $3,916
Basic weighted-average common shares outstanding 514 529 528
Dilutive potential common shares (b) 784
Diluted weighted-average common shares outstanding 521 537 532
Diluted earnings per common share (a) $ 7.39 $ 7.30 $ 7.36
(a) Basic and diluted earnings per share under the two-class method are determined on net income reported on the income statement less earnings allocated to nonvested restricted shares
and restricted share units with nonforfeitable dividends and dividend rights (participating securities).
(b) Excludes number of stock options considered to be anti-dilutive of 1 million for 2013. No warrants were considered to be anti-dilutive for 2013. No stock options or warrants were
considered to be anti-dilutive for 2014 and 2015.
N
OTE
16 E
QUITY
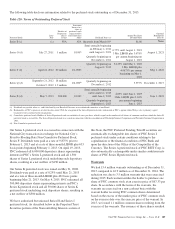
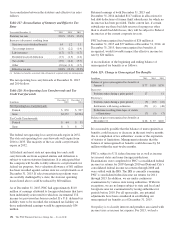
Preferred Stock
The following table provides the number of preferred shares issued and outstanding, the liquidation value per share and the number
of authorized preferred shares that are available for future use.
Table 119: Preferred Stock – Authorized, Issued and Outstanding
Preferred Shares
December 31
Shares in thousands
Liquidation
value per
share 2015 2014
Authorized
$1 par value 16,588 16,588
Issued and outstanding
Series B $40 1 1
Series K $ 10,000 50
Series O $100,000 10 10
Series P $100,000 15 15
Series Q $100,000 5 5
Series R $100,000 5 5
Total issued and outstanding 36 86
188 The PNC Financial Services Group, Inc. – Form 10-K