PNC Bank 2015 Annual Report Download - page 111
Download and view the complete annual report
Please find page 111 of the 2015 PNC Bank annual report below. You can navigate through the pages in the report by either clicking on the pages listed below, or by using the keyword search tool below to find specific information within the annual report.-
 1
1 -
2
-
3
-
4
-
5
-
6
-
7
-
8
-
9
-
10
-
11
-
12
-
13
-
14
-
15
-
16
-
17
-
18
-
19
-
20
-
21
-
22
-
23
-
24
-
25
-
26
-
27
-
28
-
29
-
30
-
31
-
32
-
33
-
34
-
35
-
36
-
37
-
38
-
39
-
40
-
41
-
42
-
43
-
44
-
45
-
46
-
47
-
48
-
49
-
50
-
51
-
52
-
53
-
54
-
55
-
56
-
57
-
58
-
59
-
60
-
61
-
62
-
63
-
64
-
65
-
66
-
67
-
68
-
69
-
70
-
71
-
72
-
73
-
74
-
75
-
76
-
77
-
78
-
79
-
80
-
81
-
82
-
83
-
84
-
85
-
86
-
87
-
88
-
89
-
90
-
91
-
92
-
93
-
94
-
95
-
96
-
97
-
98
-
99
-
100
-
 101
101 -
 102
102 -
 103
103 -
 104
104 -
 105
105 -
 106
106 -
 107
107 -
 108
108 -
 109
109 -
 110
110 -
 111
111 -
 112
112 -
 113
113 -
 114
114 -
 115
115 -
 116
116 -
 117
117 -
 118
118 -
 119
119 -
 120
120 -
 121
121 -
122
-
123
-
124
-
125
-
126
-
127
-
128
-
129
-
130
-
131
-
132
-
133
-
134
-
135
-
136
-
137
-
138
-
139
-
140
-
141
-
142
-
143
-
144
-
145
-
146
-
147
-
148
-
149
-
150
-
151
-
152
-
153
-
154
-
155
-
156
-
157
-
158
-
159
-
160
-
161
-
162
-
163
-
164
-
165
-
166
-
167
-
168
-
169
-
170
-
171
-
172
-
173
-
174
-
175
-
176
-
177
-
178
-
179
-
180
-
181
-
182
-
183
-
184
-
185
-
186
-
187
-
188
-
189
-
190
-
191
-
192
-
193
-
194
-
195
-
196
-
197
-
198
-
199
-
200
-
201
-
202
-
203
-
204
-
205
-
206
-
207
-
208
-
209
-
210
-
211
-
212
-
213
-
214
-
215
-
216
-
217
-
218
-
219
-
220
-
221
-
222
-
223
-
224
-
225
-
226
-
227
-
228
-
229
-
230
-
231
-
232
-
233
-
234
-
235
-
236
-
237
-
238
-
239
-
240
-
241
-
242
-
243
-
244
-
245
-
246
-
247
-
248
-
249
-
250
-
251
-
252
-
253
-
254
-
255
-
256
 |
 |

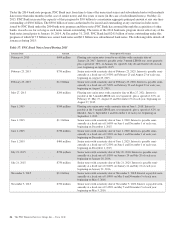
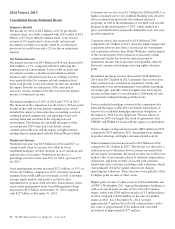
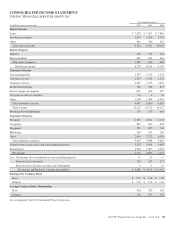
Provision For Credit Losses
The provision for credit losses totaled $273 million in 2014
compared with $643 million in 2013. The decrease in
provision reflected improved overall credit quality, including
lower consumer loan delinquencies. A contributing economic
factor was the increasing value of residential real estate, which
improved expected cash flows from our purchased impaired
loans.
Noninterest Expense
Noninterest expense was $9.5 billion for 2014, a decrease of
$.2 billion, or 2%, compared to 2013, reflecting overall
disciplined expense management. The decline was driven by a
decrease in personnel expense related to lower headcount and
benefits costs, partially offset by investments in technology
and infrastructure. Additionally, noncash charges in 2013 for
unamortized discounts related to redemption of trust preferred
securities contributed to the decline. See Note 14 Capital
Securities of Subsidiary Trusts and Perpetual Trust Securities
in Item 8 of our 2013 Form 10-K for additional detail on the
2013 redemption of trust preferred securities.
During 2014, we completed actions and exceeded our 2014
continuous improvement goal of $500 million in cost savings.
These cost savings funded investments in our infrastructure,
including those related to cybersecurity and our datacenters,
and investments in our diversified businesses, including our
Retail Banking transformation, consistent with our strategic
priorities.
Effective Income Tax Rate
The effective income tax rate was 25.1% for 2014 compared
with 25.9% for 2013. The effective tax rate is generally lower
than the statutory rate primarily due to tax credits PNC
receives from our investments in low income housing and new
markets investments, as well as earnings in other tax exempt
investments.
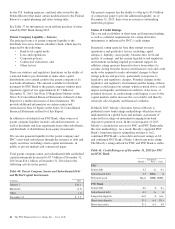
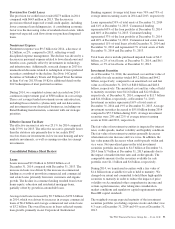
Consolidated Balance Sheet Review
Loans
Loans increased $9.2 billion to $204.8 billion as of
December 31, 2014 compared with December 31, 2013. The
increase in loans was driven by the increase in commercial
lending as a result of growth in commercial and commercial
real estate loans, primarily from new customers and organic
growth. The decline in consumer lending resulted from lower
home equity, education and residential mortgage loans,
partially offset by growth in automobile loans.
Average total loans increased by $9.7 billion to $199.6 billion
in 2014, which was driven by increases in average commercial
loans of $6.4 billion and average commercial real estate loans
of $3.2 billion. The overall increase in loans reflected organic
loan growth, primarily in our Corporate & Institutional
Banking segment. Average total loans were 70% and 73% of
average interest-earning assets in 2014 and 2013, respectively.
Loans represented 59% of total assets at December 31, 2014
and 61% at December 31, 2013. Commercial lending
represented 63% of the loan portfolio at December 31, 2014
and 60% at December 31, 2013. Consumer lending
represented 37% of the loan portfolio at December 31, 2014
and 40% at December 31, 2013. Commercial real estate loans
represented 11% of total loans at both December 31, 2014 and
December 31, 2013 and represented 7% of total assets at both
December 31, 2014 and December 31, 2013.
Total loans above include purchased impaired loans of $4.9
billion, or 2% of total loans, at December 31, 2014, and $6.1
billion, or 3% of total loans, at December 31, 2013.
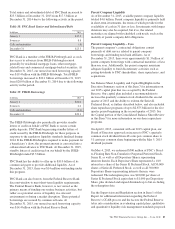
Investment Securities
As of December 31, 2014, the amortized cost and fair value of
available for sale securities totaled $43.2 billion and $44.2
billion, respectively, compared to an amortized cost and fair
value as of December 31, 2013 of $48.0 billion and $48.6
billion, respectively. The amortized cost and fair value of held
to maturity securities were $11.6 billion and $12.0 billion,
respectively, at December 31, 2014, compared to $11.7 billion
and $11.8 billion, respectively, at December 31, 2013.
Investment securities represented 16% of total assets at
December 31, 2014 and 19% at December 31, 2013. Average
investment securities decreased to $55.8 billion during 2014
compared to $57.3 billion during 2013. Average investment
securities were 20% and 22% of average interest-earning
assets in 2014 and 2013, respectively.
The fair value of investment securities is impacted by interest
rates, credit spreads, market volatility and liquidity conditions.
The fair value of investment securities generally decreases
when interest rates increase and vice versa. In addition, the
fair value generally decreases when credit spreads widen and
vice versa. Net unrealized gains in the total investment
securities portfolio increased to $1.5 billion at December 31,
2014 from $.7 billion at December 31, 2013 primarily due to
the impact of market interest rates and credit spreads. The
comparable amounts for the securities available for sale
portfolio were $1.1 billion and $.6 billion, respectively.
During 2014, we transferred securities with a fair value of
$1.4 billion from available for sale to held to maturity. We
changed our intent and committed to hold these high-quality
securities to maturity in order to reduce the impact of price
volatility on Accumulated other comprehensive income and
certain capital measures, after taking into consideration
market conditions and regulatory capital requirements under
Basel III capital standards.
The weighted-average expected maturity of the investment
securities portfolio (excluding corporate stocks and other) was
4.3 years at December 31, 2014 and 4.9 years at December 31,
2013.
The PNC Financial Services Group, Inc. – Form 10-K 93