PNC Bank 2015 Annual Report Download - page 151
Download and view the complete annual report
Please find page 151 of the 2015 PNC Bank annual report below. You can navigate through the pages in the report by either clicking on the pages listed below, or by using the keyword search tool below to find specific information within the annual report.-
 1
1 -
2
-
3
-
4
-
5
-
6
-
7
-
8
-
9
-
10
-
11
-
12
-
13
-
14
-
15
-
16
-
17
-
18
-
19
-
20
-
21
-
22
-
23
-
24
-
25
-
26
-
27
-
28
-
29
-
30
-
31
-
32
-
33
-
34
-
35
-
36
-
37
-
38
-
39
-
40
-
41
-
42
-
43
-
44
-
45
-
46
-
47
-
48
-
49
-
50
-
51
-
52
-
53
-
54
-
55
-
56
-
57
-
58
-
59
-
60
-
61
-
62
-
63
-
64
-
65
-
66
-
67
-
68
-
69
-
70
-
71
-
72
-
73
-
74
-
75
-
76
-
77
-
78
-
79
-
80
-
81
-
82
-
83
-
84
-
85
-
86
-
87
-
88
-
89
-
90
-
91
-
92
-
93
-
94
-
95
-
96
-
97
-
98
-
99
-
100
-
101
-
102
-
103
-
104
-
105
-
106
-
107
-
108
-
109
-
110
-
111
-
112
-
113
-
114
-
115
-
116
-
117
-
118
-
119
-
120
-
121
-
122
-
123
-
124
-
125
-
126
-
127
-
128
-
129
-
130
-
131
-
132
-
133
-
134
-
135
-
136
-
137
-
138
-
139
-
140
-
 141
141 -
 142
142 -
 143
143 -
 144
144 -
 145
145 -
 146
146 -
 147
147 -
 148
148 -
 149
149 -
 150
150 -
 151
151 -
 152
152 -
 153
153 -
 154
154 -
 155
155 -
 156
156 -
 157
157 -
 158
158 -
 159
159 -
 160
160 -
 161
161 -
162
-
163
-
164
-
165
-
166
-
167
-
168
-
169
-
170
-
171
-
172
-
173
-
174
-
175
-
176
-
177
-
178
-
179
-
180
-
181
-
182
-
183
-
184
-
185
-
186
-
187
-
188
-
189
-
190
-
191
-
192
-
193
-
194
-
195
-
196
-
197
-
198
-
199
-
200
-
201
-
202
-
203
-
204
-
205
-
206
-
207
-
208
-
209
-
210
-
211
-
212
-
213
-
214
-
215
-
216
-
217
-
218
-
219
-
220
-
221
-
222
-
223
-
224
-
225
-
226
-
227
-
228
-
229
-
230
-
231
-
232
-
233
-
234
-
235
-
236
-
237
-
238
-
239
-
240
-
241
-
242
-
243
-
244
-
245
-
246
-
247
-
248
-
249
-
250
-
251
-
252
-
253
-
254
-
255
-
256
 |
 |

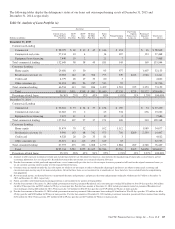
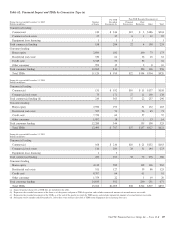
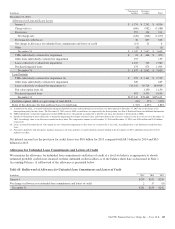
Table 59: Home Equity and Residential Real Estate Asset Quality Indicators – Purchased Impaired Loans (a)
Home Equity (b) (c) Residential Real Estate (b) (c)
December 31, 2015 – in millions 1st Liens 2nd Liens Total
Current estimated LTV ratios (d)
Greater than or equal to 125% and updated FICO scores:
Greater than 660 $ 6 $ 164 $ 147 $ 317
Less than or equal to 660 6 79 76 161
Missing FICO 7512
Greater than or equal to 100% to less than 125% and updated FICO scores:
Greater than 660 12 331 186 529
Less than or equal to 660 9 145 118 272
Missing FICO 8715
Greater than or equal to 90% to less than 100% and updated FICO scores:
Greater than 660 10 167 133 310
Less than or equal to 660 6 75 68 149
Missing FICO 437
Less than 90% and updated FICO scores:
Greater than 660 106 345 665 1,116
Less than or equal to 660 91 182 455 728
Missing FICO 1 13 31 45
Missing LTV and updated FICO scores:
Greater than 660 1 14 15
Less than or equal to 660 1 6 7
Missing FICO 11
Total home equity and residential real estate loans $249 $1,520 $1,915 $3,684
(continued on following page)
The PNC Financial Services Group, Inc. – Form 10-K 133