PNC Bank 2015 Annual Report Download - page 173
Download and view the complete annual report
Please find page 173 of the 2015 PNC Bank annual report below. You can navigate through the pages in the report by either clicking on the pages listed below, or by using the keyword search tool below to find specific information within the annual report.-
 1
1 -
2
-
3
-
4
-
5
-
6
-
7
-
8
-
9
-
10
-
11
-
12
-
13
-
14
-
15
-
16
-
17
-
18
-
19
-
20
-
21
-
22
-
23
-
24
-
25
-
26
-
27
-
28
-
29
-
30
-
31
-
32
-
33
-
34
-
35
-
36
-
37
-
38
-
39
-
40
-
41
-
42
-
43
-
44
-
45
-
46
-
47
-
48
-
49
-
50
-
51
-
52
-
53
-
54
-
55
-
56
-
57
-
58
-
59
-
60
-
61
-
62
-
63
-
64
-
65
-
66
-
67
-
68
-
69
-
70
-
71
-
72
-
73
-
74
-
75
-
76
-
77
-
78
-
79
-
80
-
81
-
82
-
83
-
84
-
85
-
86
-
87
-
88
-
89
-
90
-
91
-
92
-
93
-
94
-
95
-
96
-
97
-
98
-
99
-
100
-
101
-
102
-
103
-
104
-
105
-
106
-
107
-
108
-
109
-
110
-
111
-
112
-
113
-
114
-
115
-
116
-
117
-
118
-
119
-
120
-
121
-
122
-
123
-
124
-
125
-
126
-
127
-
128
-
129
-
130
-
131
-
132
-
133
-
134
-
135
-
136
-
137
-
138
-
139
-
140
-
141
-
142
-
143
-
144
-
145
-
146
-
147
-
148
-
149
-
150
-
151
-
152
-
153
-
154
-
155
-
156
-
157
-
158
-
159
-
160
-
161
-
162
-
 163
163 -
 164
164 -
 165
165 -
 166
166 -
 167
167 -
 168
168 -
 169
169 -
 170
170 -
 171
171 -
 172
172 -
 173
173 -
 174
174 -
 175
175 -
 176
176 -
 177
177 -
 178
178 -
 179
179 -
 180
180 -
 181
181 -
 182
182 -
 183
183 -
184
-
185
-
186
-
187
-
188
-
189
-
190
-
191
-
192
-
193
-
194
-
195
-
196
-
197
-
198
-
199
-
200
-
201
-
202
-
203
-
204
-
205
-
206
-
207
-
208
-
209
-
210
-
211
-
212
-
213
-
214
-
215
-
216
-
217
-
218
-
219
-
220
-
221
-
222
-
223
-
224
-
225
-
226
-
227
-
228
-
229
-
230
-
231
-
232
-
233
-
234
-
235
-
236
-
237
-
238
-
239
-
240
-
241
-
242
-
243
-
244
-
245
-
246
-
247
-
248
-
249
-
250
-
251
-
252
-
253
-
254
-
255
-
256
 |
 |

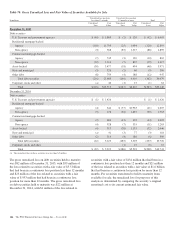
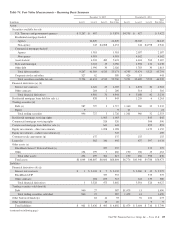
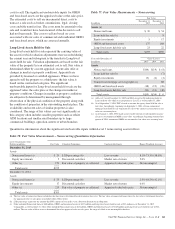
Table 74: Fair Value Measurements – Recurring Basis Summary
December 31, 2015 December 31, 2014
In millions Level 1 Level 2 Level 3
Total
Fair Value Level 1 Level 2 Level 3
Total
Fair Value
Assets
Securities available for sale
U.S. Treasury and government agencies $ 9,267 $ 607 $ 9,874 $4,795 $ 627 $ 5,422
Residential mortgage-backed
Agency 24,820 24,820 18,043 18,043
Non-agency 143 $4,008 4,151 144 $4,798 4,942
Commercial mortgage-backed
Agency 1,918 1,918 2,187 2,187
Non-agency 4,903 4,903 4,162 4,162
Asset-backed 4,941 482 5,423 4,624 563 5,187
State and municipal 2,041 15 2,056 1,904 134 2,038
Other debt 1,996 30 2,026 1,783 30 1,813
Total debt securities 9,267 41,369 4,535 55,171 4,795 33,474 5,525 43,794
Corporate stocks and other 527 62 589 426 15 441
Total securities available for sale 9,794 41,431 4,535 55,760 5,221 33,489 5,525 44,235
Financial derivatives (a) (b)
Interest rate contracts 4,626 29 4,655 4 4,874 40 4,918
Other contracts 284 2 286 314 2 316
Total financial derivatives 4,910 31 4,941 4 5,188 42 5,234
Residential mortgage loans held for sale (c) 838 5 843 1,255 6 1,261
Trading securities (d)
Debt (e) 987 727 3 1,717 1,340 960 32 2,332
Equity 9 9 21 21
Total trading securities 996 727 3 1,726 1,361 960 32 2,353
Residential mortgage servicing rights 1,063 1,063 845 845
Commercial mortgage servicing rights 526 526 506 506
Commercial mortgage loans held for sale (c) 641 641 893 893
Equity investments – direct investments 1,098 1,098 1,152 1,152
Equity investments – indirect investments (f) 347 469
Customer resale agreements (g) 137 137 155 155
Loans (h) 565 340 905 637 397 1,034
Other assets (a)
BlackRock Series C Preferred Stock (i) 357 357 375 375
Other 254 199 7 460 190 256 15 461
Total other assets 254 199 364 817 190 256 390 836
Total assets $11,044 $48,807 $8,606 $68,804 $6,776 $41,940 $9,788 $58,973
Liabilities
Financial derivatives (b) (j)
Interest rate contracts $ 1 $ 3,124 $ 7 $ 3,132 $ 3,260 $ 12 $ 3,272
BlackRock LTIP 357 357 375 375
Other contracts 204 109 313 241 139 380
Total financial derivatives 1 3,328 473 3,802 3,501 526 4,027
Trading securities sold short (k)
Debt 960 27 987 $1,479 11 1,490
Total trading securities sold short 960 27 987 1,479 11 1,490
Other borrowed funds (k) 81 12 93 92 181 273
Other liabilities (j) 10 10 9 9
Total liabilities $ 961 $ 3,436 $ 495 $ 4,892 $1,479 $ 3,604 $ 716 $ 5,799
(continued on following page)
The PNC Financial Services Group, Inc. – Form 10-K 155