PNC Bank 2015 Annual Report Download - page 186
Download and view the complete annual report
Please find page 186 of the 2015 PNC Bank annual report below. You can navigate through the pages in the report by either clicking on the pages listed below, or by using the keyword search tool below to find specific information within the annual report.-
 1
1 -
2
-
3
-
4
-
5
-
6
-
7
-
8
-
9
-
10
-
11
-
12
-
13
-
14
-
15
-
16
-
17
-
18
-
19
-
20
-
21
-
22
-
23
-
24
-
25
-
26
-
27
-
28
-
29
-
30
-
31
-
32
-
33
-
34
-
35
-
36
-
37
-
38
-
39
-
40
-
41
-
42
-
43
-
44
-
45
-
46
-
47
-
48
-
49
-
50
-
51
-
52
-
53
-
54
-
55
-
56
-
57
-
58
-
59
-
60
-
61
-
62
-
63
-
64
-
65
-
66
-
67
-
68
-
69
-
70
-
71
-
72
-
73
-
74
-
75
-
76
-
77
-
78
-
79
-
80
-
81
-
82
-
83
-
84
-
85
-
86
-
87
-
88
-
89
-
90
-
91
-
92
-
93
-
94
-
95
-
96
-
97
-
98
-
99
-
100
-
101
-
102
-
103
-
104
-
105
-
106
-
107
-
108
-
109
-
110
-
111
-
112
-
113
-
114
-
115
-
116
-
117
-
118
-
119
-
120
-
121
-
122
-
123
-
124
-
125
-
126
-
127
-
128
-
129
-
130
-
131
-
132
-
133
-
134
-
135
-
136
-
137
-
138
-
139
-
140
-
141
-
142
-
143
-
144
-
145
-
146
-
147
-
148
-
149
-
150
-
151
-
152
-
153
-
154
-
155
-
156
-
157
-
158
-
159
-
160
-
161
-
162
-
163
-
164
-
165
-
166
-
167
-
168
-
169
-
170
-
171
-
172
-
173
-
174
-
175
-
 176
176 -
 177
177 -
 178
178 -
 179
179 -
 180
180 -
 181
181 -
 182
182 -
 183
183 -
 184
184 -
 185
185 -
 186
186 -
 187
187 -
 188
188 -
 189
189 -
 190
190 -
 191
191 -
 192
192 -
 193
193 -
 194
194 -
 195
195 -
 196
196 -
197
-
198
-
199
-
200
-
201
-
202
-
203
-
204
-
205
-
206
-
207
-
208
-
209
-
210
-
211
-
212
-
213
-
214
-
215
-
216
-
217
-
218
-
219
-
220
-
221
-
222
-
223
-
224
-
225
-
226
-
227
-
228
-
229
-
230
-
231
-
232
-
233
-
234
-
235
-
236
-
237
-
238
-
239
-
240
-
241
-
242
-
243
-
244
-
245
-
246
-
247
-
248
-
249
-
250
-
251
-
252
-
253
-
254
-
255
-
256
 |
 |

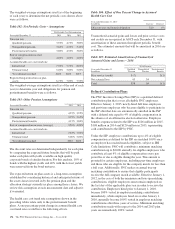
changes in prepayment rate estimates, could result in changes
in the interest rate spread), which could either magnify or
counteract the sensitivities.
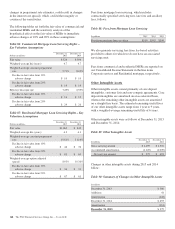
The following tables set forth the fair value of commercial and
residential MSRs and the sensitivity analysis of the
hypothetical effect on the fair value of MSRs to immediate
adverse changes of 10% and 20% in those assumptions:
Table 86: Commercial Mortgage Loan Servicing Rights –
Key Valuation Assumptions
Dollars in millions
December 31
2015
December 31
2014
Fair value $ 526 $ 506
Weighted-average life (years) 4.7 4.7
Weighted-average constant prepayment
rate 5.71% 8.03%
Decline in fair value from 10%
adverse change $ 10 $ 10
Decline in fair value from 20%
adverse change $ 19 $ 19
Effective discount rate 7.49% 6.59%
Decline in fair value from 10%
adverse change $ 14 $ 13
Decline in fair value from 20%
adverse change $ 29 $ 26
Table 87: Residential Mortgage Loan Servicing Rights – Key
Valuation Assumptions
Dollars in millions
December 31
2015
December 31
2014
Fair value $1,063 $ 845
Weighted-average life (years) 6.3 6.1
Weighted-average constant prepayment
rate 10.61% 11.16%
Decline in fair value from 10%
adverse change $ 44 $ 36
Decline in fair value from 20%
adverse change $ 85 $ 69
Weighted-average option adjusted
spread 8.93% 10.36%
Decline in fair value from 10%
adverse change $ 34 $ 31
Decline in fair value from 20%
adverse change $ 67 $ 61
Fees from mortgage loan servicing, which includes
contractually specified servicing fees, late fees and ancillary
fees, follows:
Table 88: Fees from Mortgage Loan Servicing
In millions 2015 2014 2013
Fees from mortgage loan servicing $510 $503 $544
We also generate servicing fees from fee-based activities
provided to others for which we do not have an associated
servicing asset.
Fees from commercial and residential MSRs are reported on
our Consolidated Income Statement in the line items
Corporate services and Residential mortgage, respectively.
Other Intangible Assets
Other intangible assets consist primarily of core deposit
intangibles, customer lists and non-compete agreements. Core
deposit intangibles are amortized on an accelerated basis,
whereas the remaining other intangible assets are amortized
on a straight-line basis. The estimated remaining useful lives
of our other intangible assets range from 1 year to 9 years,
with a weighted-average remaining useful life of 6 years.
Other intangible assets were as follows at December 31, 2015
and December 31, 2014:
Table 89: Other Intangible Assets
In millions
December 31
2015
December 31
2014
Gross carrying amount $ 1,499 $ 1,502
Accumulated amortization (1,120) (1,009)
Net carrying amount $ 379 $ 493
Changes in other intangible assets during 2015 and 2014
follow:
Table 90: Summary of Changes in Other Intangible Assets
In millions
December 31, 2013 $ 580
Additions 41
Amortization (128)
December 31, 2014 $ 493
Amortization (114)
December 31, 2015 $ 379
168 The PNC Financial Services Group, Inc. – Form 10-K