Wells Fargo 2014 Annual Report Download - page 99
Download and view the complete annual report
Please find page 99 of the 2014 Wells Fargo annual report below. You can navigate through the pages in the report by either clicking on the pages listed below, or by using the keyword search tool below to find specific information within the annual report.-
 1
1 -
2
-
3
-
4
-
5
-
6
-
7
-
8
-
9
-
10
-
11
-
12
-
13
-
14
-
15
-
16
-
17
-
18
-
19
-
20
-
21
-
22
-
23
-
24
-
25
-
26
-
27
-
28
-
29
-
30
-
31
-
32
-
33
-
34
-
35
-
36
-
37
-
38
-
39
-
40
-
41
-
42
-
43
-
44
-
45
-
46
-
47
-
48
-
49
-
50
-
51
-
52
-
53
-
54
-
55
-
56
-
57
-
58
-
59
-
60
-
61
-
62
-
63
-
64
-
65
-
66
-
67
-
68
-
69
-
70
-
71
-
72
-
73
-
74
-
75
-
76
-
77
-
78
-
79
-
80
-
81
-
82
-
83
-
84
-
85
-
86
-
87
-
88
-
 89
89 -
 90
90 -
 91
91 -
 92
92 -
 93
93 -
 94
94 -
 95
95 -
 96
96 -
 97
97 -
 98
98 -
 99
99 -
 100
100 -
 101
101 -
 102
102 -
 103
103 -
 104
104 -
 105
105 -
 106
106 -
 107
107 -
 108
108 -
 109
109 -
110
-
111
-
112
-
113
-
114
-
115
-
116
-
117
-
118
-
119
-
120
-
121
-
122
-
123
-
124
-
125
-
126
-
127
-
128
-
129
-
130
-
131
-
132
-
133
-
134
-
135
-
136
-
137
-
138
-
139
-
140
-
141
-
142
-
143
-
144
-
145
-
146
-
147
-
148
-
149
-
150
-
151
-
152
-
153
-
154
-
155
-
156
-
157
-
158
-
159
-
160
-
161
-
162
-
163
-
164
-
165
-
166
-
167
-
168
-
169
-
170
-
171
-
172
-
173
-
174
-
175
-
176
-
177
-
178
-
179
-
180
-
181
-
182
-
183
-
184
-
185
-
186
-
187
-
188
-
189
-
190
-
191
-
192
-
193
-
194
-
195
-
196
-
197
-
198
-
199
-
200
-
201
-
202
-
203
-
204
-
205
-
206
-
207
-
208
-
209
-
210
-
211
-
212
-
213
-
214
-
215
-
216
-
217
-
218
-
219
-
220
-
221
-
222
-
223
-
224
-
225
-
226
-
227
-
228
-
229
-
230
-
231
-
232
-
233
-
234
-
235
-
236
-
237
-
238
-
239
-
240
-
241
-
242
-
243
-
244
-
245
-
246
-
247
-
248
-
249
-
250
-
251
-
252
-
253
-
254
-
255
-
256
-
257
-
258
-
259
-
260
-
261
-
262
-
263
-
264
-
265
-
266
-
267
-
268
 |
 |
LIQUIDITY AND FUNDING The objective of effective liquidity
management is to ensure that we can meet customer loan
requests, customer deposit maturities/withdrawals and other
cash commitments efficiently under both normal operating
conditions and under periods of Wells Fargo-specific and/or
market stress. To achieve this objective, the Board of Directors
establishes liquidity guidelines that require sufficient asset-
based liquidity to cover potential funding requirements and to
avoid over-dependence on volatile, less reliable funding markets.
These guidelines are monitored on a monthly basis by the
Corporate ALCO and on a quarterly basis by the Board of
Directors. These guidelines are established and monitored for
both the consolidated company and for the Parent on a stand-
alone basis to ensure that the Parent is a source of strength for
its regulated, deposit-taking banking subsidiaries.
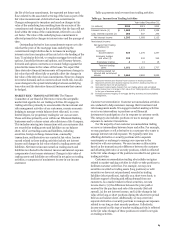
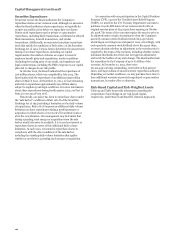
We maintain liquidity in the form of cash, cash equivalents
and unencumbered high-quality, liquid securities. These assets
make up our primary sources of liquidity which are presented in
Table 55: Primary Sources of Liquidity
Table 55. Our cash is primarily on deposit with the Federal
Reserve. Securities included as part of our primary sources of
liquidity are comprised of U.S. Treasury and federal agency debt,
and mortgage-backed securities issued by federal agencies
within our investment securities portfolio. We believe these
securities provide quick sources of liquidity through sales or by
pledging to obtain financing, regardless of market conditions.
Some of these securities are within the held-to-maturity portion
of our investment securities portfolio and as such are not
intended for sale but may be pledged to obtain financing. Some
of the legal entities within our consolidated group of companies
are subject to various regulatory, tax, legal and other restrictions
that can limit the transferability of their funds. We believe we
maintain adequate liquidity at these entities in consideration of
such funds transfer restrictions.
December 31, 2014 December 31, 2013
(in millions) Total Encumbered Unencumbered Total Encumbered Unencumbered
Interest-earning deposits $ 219,220 — 219,220 186,249 — 186,249
Securities of U.S. Treasury and federal agencies (1) 67,352 856 66,496 6,280 571 5,709
Mortgage-backed securities of federal agencies (2) 115,730 80,324 35,406 123,796 60,605 63,191
Total $ 402,302 81,180 321,122 316,325 61,176 255,149
(1) Included in encumbered securities at December 31, 2014, were securities with a fair value of $152 million which were purchased in December 2014, but settled in
January 2015.
(2) Included in encumbered securities at December 31, 2014, were securities with a fair value of $5 million which were purchased in December 2014, but settled in
January 2015. Included in encumbered securities at December 31, 2013, were securities with a fair value of $653 million which were purchased in December 2013, but
settled in January 2014.
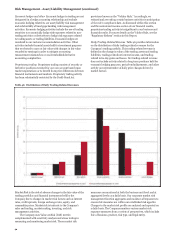
In addition to our primary sources of liquidity shown in Core customer deposits have historically provided a sizeable
Table 55, liquidity is also available through the sale or financing source of relatively stable and low-cost funds. At December 31,
of other securities including trading and/or available-for-sale 2014, core deposits were 122% of total loans compared with
securities, as well as through the sale, securitization or financing 119% a year ago. Additional funding is provided by long-term
of loans, to the extent such securities and loans are not debt, other foreign deposits, and short-term borrowings.
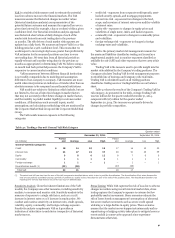
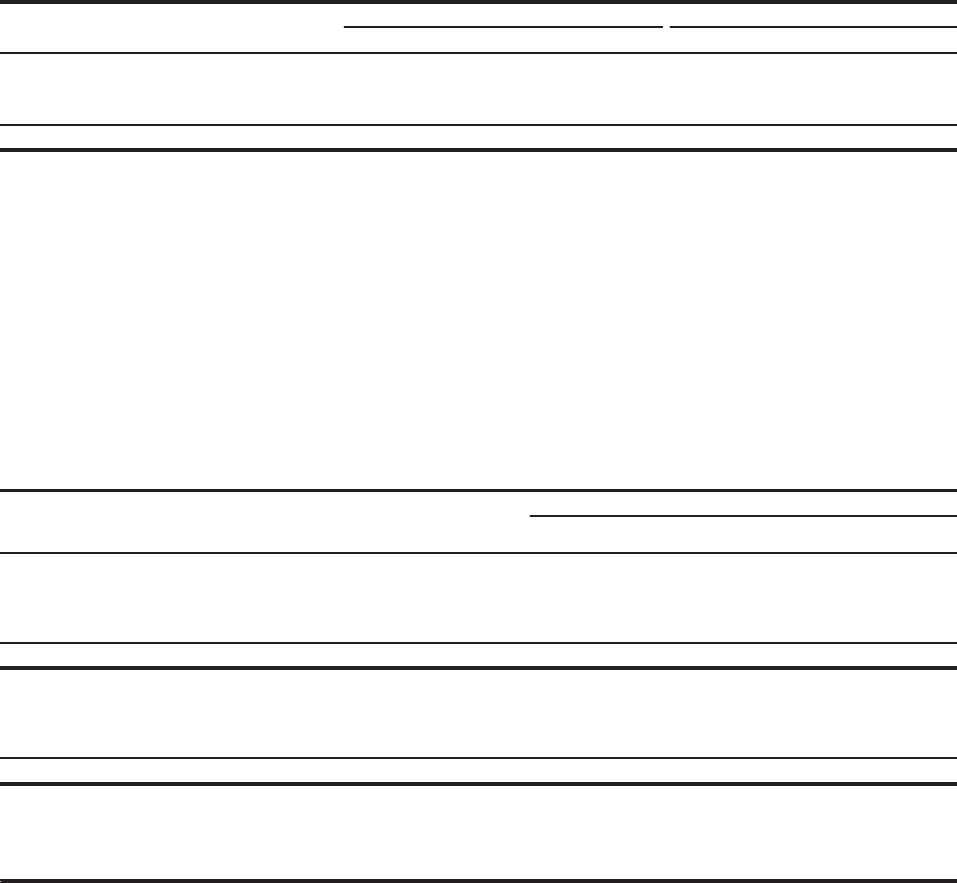
encumbered. In addition, other securities in our held-to- Table 56 shows selected information for short-term
maturity portfolio, to the extent not encumbered, may be borrowings, which generally mature in less than 30 days.
pledged to obtain financing.
Table 56: Short-Term Borrowings
Quarter ended
Dec 31, Sep 30, Jun 30, Mar 31, Dec 31,
(in millions) 2014 2014 2014 2014 2013
Balance, period end
Federal funds purchased and securities sold under agreements to repurchase $ 51,052 48,164 45,379 39,254 36,263
Commercial paper 2,456 4,365 4,261 6,070 5,162
Other short-term borrowings 10,010 10,398 12,209 11,737 12,458
Total $ 63,518 62,927 61,849 57,061 53,883
Average daily balance for period
Federal funds purchased and securities sold under agreements to repurchase $ 51,509 47,088 42,233 37,711 36,232
Commercial paper 3,511 4,587 5,221 5,713 4,731
Other short-term borrowings 9,656 10,610 11,391 11,078 11,323
Total $ 64,676 62,285 58,845 54,502 52,286
Maximum month-end balance for period
Federal funds purchased and securities sold under agreements to repurchase (1) $ 51,052 48,164 45,379 39,589 36,263
Commercial paper (2) 3,740 4,665 5,175 6,070 5,162
Other short-term borrowings (3) 10,010 10,990 12,209 11,737 12,458
(1) Highest month-end balance in each of the last five quarters was in December, September, June and February 2014, and December 2013.
(2) Highest month-end balance in each of the last five quarters was in November, July, April and March 2014, and December 2013.
(3) Highest month-end balance in each of the last five quarters was in December, July, June and March 2014, and December 2013.
97