Wells Fargo 2014 Annual Report Download - page 193
Download and view the complete annual report
Please find page 193 of the 2014 Wells Fargo annual report below. You can navigate through the pages in the report by either clicking on the pages listed below, or by using the keyword search tool below to find specific information within the annual report.-
 1
1 -
2
-
3
-
4
-
5
-
6
-
7
-
8
-
9
-
10
-
11
-
12
-
13
-
14
-
15
-
16
-
17
-
18
-
19
-
20
-
21
-
22
-
23
-
24
-
25
-
26
-
27
-
28
-
29
-
30
-
31
-
32
-
33
-
34
-
35
-
36
-
37
-
38
-
39
-
40
-
41
-
42
-
43
-
44
-
45
-
46
-
47
-
48
-
49
-
50
-
51
-
52
-
53
-
54
-
55
-
56
-
57
-
58
-
59
-
60
-
61
-
62
-
63
-
64
-
65
-
66
-
67
-
68
-
69
-
70
-
71
-
72
-
73
-
74
-
75
-
76
-
77
-
78
-
79
-
80
-
81
-
82
-
83
-
84
-
85
-
86
-
87
-
88
-
89
-
90
-
91
-
92
-
93
-
94
-
95
-
96
-
97
-
98
-
99
-
100
-
101
-
102
-
103
-
104
-
105
-
106
-
107
-
108
-
109
-
110
-
111
-
112
-
113
-
114
-
115
-
116
-
117
-
118
-
119
-
120
-
121
-
122
-
123
-
124
-
125
-
126
-
127
-
128
-
129
-
130
-
131
-
132
-
133
-
134
-
135
-
136
-
137
-
138
-
139
-
140
-
141
-
142
-
143
-
144
-
145
-
146
-
147
-
148
-
149
-
150
-
151
-
152
-
153
-
154
-
155
-
156
-
157
-
158
-
159
-
160
-
161
-
162
-
163
-
164
-
165
-
166
-
167
-
168
-
169
-
170
-
171
-
172
-
173
-
174
-
175
-
176
-
177
-
178
-
179
-
180
-
181
-
182
-
 183
183 -
 184
184 -
 185
185 -
 186
186 -
 187
187 -
 188
188 -
 189
189 -
 190
190 -
 191
191 -
 192
192 -
 193
193 -
 194
194 -
 195
195 -
 196
196 -
 197
197 -
 198
198 -
 199
199 -
 200
200 -
 201
201 -
 202
202 -
 203
203 -
204
-
205
-
206
-
207
-
208
-
209
-
210
-
211
-
212
-
213
-
214
-
215
-
216
-
217
-
218
-
219
-
220
-
221
-
222
-
223
-
224
-
225
-
226
-
227
-
228
-
229
-
230
-
231
-
232
-
233
-
234
-
235
-
236
-
237
-
238
-
239
-
240
-
241
-
242
-
243
-
244
-
245
-
246
-
247
-
248
-
249
-
250
-
251
-
252
-
253
-
254
-
255
-
256
-
257
-
258
-
259
-
260
-
261
-
262
-
263
-
264
-
265
-
266
-
267
-
268
 |
 |

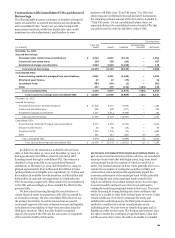
Note 9: Mortgage Banking Activities
Mortgage banking activities, included in the Community We apply the amortization method to commercial MSRs and
Banking and Wholesale Banking operating segments, consist of apply the fair value method to residential MSRs. The changes in
residential and commercial mortgage originations, sale activity MSRs measured using the fair value method were:
and servicing.
Year ended December 31,
(in millions) 2014 2013 2012
Fair value, beginning of year $ 15,580 11,538 12,603
Servicing from securitizations or asset transfers (1) 1,196 3,469 5,182
Sales (7) (583) (293)
Net additions 1,189 2,886 4,889
Changes in fair value:
Due to changes in valuation model inputs or assumptions:
Mortgage interest rates (2) (2,150) 4,362 (2,092)
Servicing and foreclosure costs (3) (20) (228) (677)
Discount rates (4) (55) — (397)
Prepayment estimates and other (5) 103 (736) 273
Net changes in valuation model inputs or assumptions (2,122) 3,398 (2,893)
Other changes in fair value (6) (1,909) (2,242) (3,061)
Total changes in fair value (4,031) 1,156 (5,954)
Fair value, end of year $ 12,738 15,580 11,538
(1) The year ended December 31, 2012, includes $315 million residential MSRs transferred from amortized MSRs that we elected to carry at fair value effective
January 1, 2012.
(2) Includes prepayment speed changes as well as other valuation changes due to changes in mortgage interest rates (such as changes in estimated interest earned on
custodial deposit balances).
(3) Includes costs to service and unreimbursed foreclosure costs.
(4) Reflects discount rate assumption change, excluding portion attributable to changes in mortgage interest rates.
(5) Represents changes driven by other valuation model inputs or assumptions including prepayment speed estimation changes and other assumption updates. Prepayment
speed estimation changes are influenced by observed changes in borrower behavior that occur independent of interest rate changes.
(6) Represents changes due to collection/realization of expected cash flows over time.
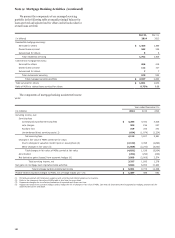
The changes in amortized MSRs were:
Year ended December 31,
(in millions) 2014 2013 2012
Balance, beginning of year $ 1,229 1,160 1,445
Purchases 157 176 177
Servicing from securitizations or asset transfers (1) 110 147 (229)
Amortization (254) (254) (233)
Balance, end of year 1,242 1,229 1,160
Valuation allowance:
Balance, beginning of year — — (37)
Reversal of provision (provision) for MSRs in excess of fair value — — 37
Balance, end of year (2) — — —
Amortized MSRs, net $ 1,242 1,229 1,160
Fair value of amortized MSRs (3):
Beginning of year $ 1,575 1,400 1,756
End of year 1,637 1,575 1,400
(1) The year ended December 31, 2012, is net of $350 million ($313 million after valuation allowance) of residential MSRs that we elected to carry at fair value effective
January 1, 2012. A cumulative adjustment of $2 million to fair value was recorded in retained earnings at January 1, 2012.
(2) Commercial amortized MSRs are evaluated for impairment purposes by the following risk strata: agency (GSEs) and non-agency. There was no valuation allowance
recorded for the periods presented on the commercial amortized MSRs. For the year ended December 31, 2012, a valuation allowance of $37 million for residential MSRs
was reversed upon election to carry at fair value.
(3) Represent commercial amortized MSRs.
191