Wells Fargo 2014 Annual Report Download - page 259
Download and view the complete annual report
Please find page 259 of the 2014 Wells Fargo annual report below. You can navigate through the pages in the report by either clicking on the pages listed below, or by using the keyword search tool below to find specific information within the annual report.-
 1
1 -
2
-
3
-
4
-
5
-
6
-
7
-
8
-
9
-
10
-
11
-
12
-
13
-
14
-
15
-
16
-
17
-
18
-
19
-
20
-
21
-
22
-
23
-
24
-
25
-
26
-
27
-
28
-
29
-
30
-
31
-
32
-
33
-
34
-
35
-
36
-
37
-
38
-
39
-
40
-
41
-
42
-
43
-
44
-
45
-
46
-
47
-
48
-
49
-
50
-
51
-
52
-
53
-
54
-
55
-
56
-
57
-
58
-
59
-
60
-
61
-
62
-
63
-
64
-
65
-
66
-
67
-
68
-
69
-
70
-
71
-
72
-
73
-
74
-
75
-
76
-
77
-
78
-
79
-
80
-
81
-
82
-
83
-
84
-
85
-
86
-
87
-
88
-
89
-
90
-
91
-
92
-
93
-
94
-
95
-
96
-
97
-
98
-
99
-
100
-
101
-
102
-
103
-
104
-
105
-
106
-
107
-
108
-
109
-
110
-
111
-
112
-
113
-
114
-
115
-
116
-
117
-
118
-
119
-
120
-
121
-
122
-
123
-
124
-
125
-
126
-
127
-
128
-
129
-
130
-
131
-
132
-
133
-
134
-
135
-
136
-
137
-
138
-
139
-
140
-
141
-
142
-
143
-
144
-
145
-
146
-
147
-
148
-
149
-
150
-
151
-
152
-
153
-
154
-
155
-
156
-
157
-
158
-
159
-
160
-
161
-
162
-
163
-
164
-
165
-
166
-
167
-
168
-
169
-
170
-
171
-
172
-
173
-
174
-
175
-
176
-
177
-
178
-
179
-
180
-
181
-
182
-
183
-
184
-
185
-
186
-
187
-
188
-
189
-
190
-
191
-
192
-
193
-
194
-
195
-
196
-
197
-
198
-
199
-
200
-
201
-
202
-
203
-
204
-
205
-
206
-
207
-
208
-
209
-
210
-
211
-
212
-
213
-
214
-
215
-
216
-
217
-
218
-
219
-
220
-
221
-
222
-
223
-
224
-
225
-
226
-
227
-
228
-
229
-
230
-
231
-
232
-
233
-
234
-
235
-
236
-
237
-
238
-
239
-
240
-
241
-
242
-
243
-
244
-
245
-
246
-
247
-
248
-
 249
249 -
 250
250 -
 251
251 -
 252
252 -
 253
253 -
 254
254 -
 255
255 -
 256
256 -
 257
257 -
 258
258 -
 259
259 -
 260
260 -
 261
261 -
 262
262 -
 263
263 -
 264
264 -
 265
265 -
 266
266 -
 267
267 -
 268
268
 |
 |

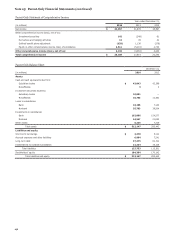
Parent-Only Statement of Cash Flows
Year ended December 31,
(in millions) 2014 2013 2012
Cash flows from operating activities:
Net cash provided by operating activities $ 18,019 8,607 13,365
Cash flows from investing activities:
Available-for-sale securities:
Sales proceeds 1,196 3,606 6,171
Prepayments and maturities:
Subsidiary banks 25 — —
Nonaffiliates — 12 30
Purchases:
Subsidiary banks (10,025) — —
Nonaffiliates (14) (6,016) (5,845)
Loans:
Net repayments from (advances to) subsidiaries (2,199) 655 9,191
Capital notes and term loans made to subsidiaries (11,275) (6,700) (1,850)
Principal collected on notes/loans made to subsidiaries 2,526 1,472 2,462
Net increase in investment in subsidiaries (1,096) (1,188) (5,218)
Other, net 470 461 (2)
Net cash provided (used) by investing activities (20,392) (7,698) 4,939
Cash flows from financing activities:
Net increase in short-term borrowings and indebtedness to subsidiaries 2,314 6,732 5,456
Long-term debt:
Proceeds from issuance 22,627 18,714 16,989
Repayment (8,659) (13,096) (18,693)
Preferred stock:
Proceeds from issuance 2,775 3,145 1,377
Cash dividends paid (1,235) (1,017) (892)
Common stock warrants repurchased — — (1)
Common stock:
Proceeds from issuance 1,840 2,224 2,091
Repurchased (9,414) (5,356) (3,918)
Cash dividends paid (6,908) (5,953) (4,565)
Excess tax benefits related to stock option payments 453 271 226
Other, net 37 114 (14)
Net cash provided (used) by financing activities 3,830 5,778 (1,944)
Net change in cash and due from banks 1,457 6,687 16,360
Cash and due from banks at beginning of year 42,389 35,702 19,342
Cash and due from banks at end of year $ 43,846 42,389 35,702
257