Wells Fargo 2014 Annual Report Download - page 221
Download and view the complete annual report
Please find page 221 of the 2014 Wells Fargo annual report below. You can navigate through the pages in the report by either clicking on the pages listed below, or by using the keyword search tool below to find specific information within the annual report.-
 1
1 -
2
-
3
-
4
-
5
-
6
-
7
-
8
-
9
-
10
-
11
-
12
-
13
-
14
-
15
-
16
-
17
-
18
-
19
-
20
-
21
-
22
-
23
-
24
-
25
-
26
-
27
-
28
-
29
-
30
-
31
-
32
-
33
-
34
-
35
-
36
-
37
-
38
-
39
-
40
-
41
-
42
-
43
-
44
-
45
-
46
-
47
-
48
-
49
-
50
-
51
-
52
-
53
-
54
-
55
-
56
-
57
-
58
-
59
-
60
-
61
-
62
-
63
-
64
-
65
-
66
-
67
-
68
-
69
-
70
-
71
-
72
-
73
-
74
-
75
-
76
-
77
-
78
-
79
-
80
-
81
-
82
-
83
-
84
-
85
-
86
-
87
-
88
-
89
-
90
-
91
-
92
-
93
-
94
-
95
-
96
-
97
-
98
-
99
-
100
-
101
-
102
-
103
-
104
-
105
-
106
-
107
-
108
-
109
-
110
-
111
-
112
-
113
-
114
-
115
-
116
-
117
-
118
-
119
-
120
-
121
-
122
-
123
-
124
-
125
-
126
-
127
-
128
-
129
-
130
-
131
-
132
-
133
-
134
-
135
-
136
-
137
-
138
-
139
-
140
-
141
-
142
-
143
-
144
-
145
-
146
-
147
-
148
-
149
-
150
-
151
-
152
-
153
-
154
-
155
-
156
-
157
-
158
-
159
-
160
-
161
-
162
-
163
-
164
-
165
-
166
-
167
-
168
-
169
-
170
-
171
-
172
-
173
-
174
-
175
-
176
-
177
-
178
-
179
-
180
-
181
-
182
-
183
-
184
-
185
-
186
-
187
-
188
-
189
-
190
-
191
-
192
-
193
-
194
-
195
-
196
-
197
-
198
-
199
-
200
-
201
-
202
-
203
-
204
-
205
-
206
-
207
-
208
-
209
-
210
-
 211
211 -
 212
212 -
 213
213 -
 214
214 -
 215
215 -
 216
216 -
 217
217 -
 218
218 -
 219
219 -
 220
220 -
 221
221 -
 222
222 -
 223
223 -
 224
224 -
 225
225 -
 226
226 -
 227
227 -
 228
228 -
 229
229 -
 230
230 -
 231
231 -
232
-
233
-
234
-
235
-
236
-
237
-
238
-
239
-
240
-
241
-
242
-
243
-
244
-
245
-
246
-
247
-
248
-
249
-
250
-
251
-
252
-
253
-
254
-
255
-
256
-
257
-
258
-
259
-
260
-
261
-
262
-
263
-
264
-
265
-
266
-
267
-
268
 |
 |

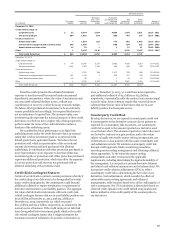
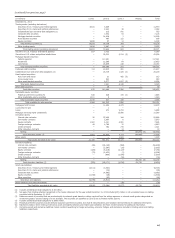
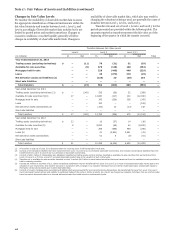
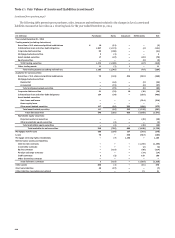
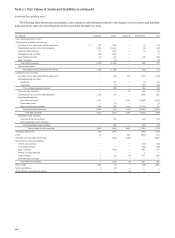
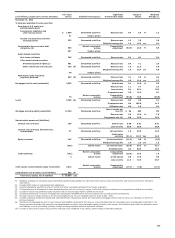
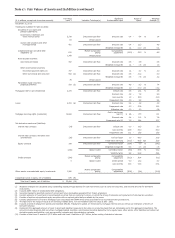
The changes in Level 3 assets and liabilities measured at fair value on a recurring basis for the year ended December 31, 2014,
are summarized as follows:
Total net gains
(losses) included in Purchases,
sales,
Net unrealized
gains (losses)
included in
Other issuances income related
(in millions)
Balance,
beginning
of period Net
income
compre-
hensive
income
and
settlements,
net (1)
Transfers
into
Level 3
Transfers
out of
Level 3
Balance,
end of
period
to assets and
liabilities held
at period end (2)
Year ended December 31, 2014
Trading assets (excluding derivatives):
Securities of U.S. states and
political subdivisions $ 39 1 — (2) — (31) 7 —
Collateralized loan and other
debt obligations 541 36 — (121) 4 (15) 445 (48)
Corporate debt securities 53 — — (21) 26 (4) 54 1
Mortgage-backed securities 1 — — 2 — (3) — —
Asset-backed securities 122 32 — (70) — (5) 79 32
Equity securities 13 — — (3) — — 10 —
Total trading securities 769 69 — (215) 30 (58) 595 (15)
Other trading assets 54 (10) — 11 1 (1) 55 (1)
Total trading assets
(excluding derivatives) 823 59 — (204) 31 (59) 650 (16) (3)
Available-for-sale securities:
Securities of U.S. states and
political subdivisions 3,214 21 (86) (569) 59 (362) 2,277 (2)
Mortgage-backed securities:
Residential 64 11 (5) (46) — — 24 —
Commercial 138 9 (1) (37) — — 109 (4)
Total mortgage-backed securities 202 20 (6) (83) — — 133 (4)
Corporate debt securities 281 25 (25) (29) — — 252 —
Collateralized loan and other
debt obligations 1,420 117 (47) (403) — — 1,087 (2)
Asset-backed securities:
Auto loans and leases 492 — (33) (214) — — 245 —
Home equity loans — — — — — — — —
Other asset-backed securities 1,657 5 (6) (373) 89 — 1,372 —
Total asset-backed securities 2,149 5 (39) (587) 89 — 1,617 —
Total debt securities 7,266 188 (203) (1,671) 148 (362) 5,366 (8) (4)
Marketable equity securities:
Perpetual preferred securities 729 8 (29) (45) — — 663 —
Other marketable equity securities — 4 — (4) — — — —
Total marketable
equity securities 729 12 (29) (49) — — 663 — (5)
Total available-for-sale
securities 7,995 200 (232) (1,720) 148 (362) 6,029 (8)
Mortgages held for sale 2,374 4 — (276) 440 (229) 2,313 7 (6)
Loans 5,723 (52) — (104) 270 (49) 5,788 (32) (6)
Mortgage servicing rights (residential) (7) 15,580 (4,031) — 1,189 — — 12,738 (2,122) (6)
Net derivative assets and liabilities:
Interest rate contracts (40) 1,588 — (1,255) — — 293 317
Commodity contracts (10) (21) — (2) (3) 37 1 (1)
Equity contracts (46) 96 — (214) (17) 97 (84) (42)
Foreign exchange contracts 9 5 — (14) — — — —
Credit contracts (375) 26 — 160 — — (189) (38)
Other derivative contracts (3) (41) — — — — (44) (40)
Total derivative contracts (465) 1,653 — (1,325) (20) 134 (23) 196 (8)
Other assets 1,503 514 — 576 — — 2,593 (8) (3)
Short sale liabilities — 1 — (7) — — (6) 1 (3)
Other liabilities (excluding derivatives) (39) (10) — 21 — — (28) (1) (6)
(1) See next page for detail.
(2) Represents only net gains (losses) that are due to changes in economic conditions and management’s estimates of fair value and excludes changes due to the collection/
realization of cash flows over time.
(3) Included in net gains (losses) from trading activities and other noninterest income in the income statement.
(4) Included in net gains (losses) from debt securities in the income statement.
(5) Included in net gains (losses) from equity investments in the income statement.
(6) Included in mortgage banking and other noninterest income in the income statement.
(7) For more information on the changes in mortgage servicing rights, see Note 9 (Mortgage Banking Activities).
(8) Included in mortgage banking, trading activities, equity investments and other noninterest income in the income statement.
(continued on following page)
219