Wells Fargo 2014 Annual Report Download - page 249
Download and view the complete annual report
Please find page 249 of the 2014 Wells Fargo annual report below. You can navigate through the pages in the report by either clicking on the pages listed below, or by using the keyword search tool below to find specific information within the annual report.-
 1
1 -
2
-
3
-
4
-
5
-
6
-
7
-
8
-
9
-
10
-
11
-
12
-
13
-
14
-
15
-
16
-
17
-
18
-
19
-
20
-
21
-
22
-
23
-
24
-
25
-
26
-
27
-
28
-
29
-
30
-
31
-
32
-
33
-
34
-
35
-
36
-
37
-
38
-
39
-
40
-
41
-
42
-
43
-
44
-
45
-
46
-
47
-
48
-
49
-
50
-
51
-
52
-
53
-
54
-
55
-
56
-
57
-
58
-
59
-
60
-
61
-
62
-
63
-
64
-
65
-
66
-
67
-
68
-
69
-
70
-
71
-
72
-
73
-
74
-
75
-
76
-
77
-
78
-
79
-
80
-
81
-
82
-
83
-
84
-
85
-
86
-
87
-
88
-
89
-
90
-
91
-
92
-
93
-
94
-
95
-
96
-
97
-
98
-
99
-
100
-
101
-
102
-
103
-
104
-
105
-
106
-
107
-
108
-
109
-
110
-
111
-
112
-
113
-
114
-
115
-
116
-
117
-
118
-
119
-
120
-
121
-
122
-
123
-
124
-
125
-
126
-
127
-
128
-
129
-
130
-
131
-
132
-
133
-
134
-
135
-
136
-
137
-
138
-
139
-
140
-
141
-
142
-
143
-
144
-
145
-
146
-
147
-
148
-
149
-
150
-
151
-
152
-
153
-
154
-
155
-
156
-
157
-
158
-
159
-
160
-
161
-
162
-
163
-
164
-
165
-
166
-
167
-
168
-
169
-
170
-
171
-
172
-
173
-
174
-
175
-
176
-
177
-
178
-
179
-
180
-
181
-
182
-
183
-
184
-
185
-
186
-
187
-
188
-
189
-
190
-
191
-
192
-
193
-
194
-
195
-
196
-
197
-
198
-
199
-
200
-
201
-
202
-
203
-
204
-
205
-
206
-
207
-
208
-
209
-
210
-
211
-
212
-
213
-
214
-
215
-
216
-
217
-
218
-
219
-
220
-
221
-
222
-
223
-
224
-
225
-
226
-
227
-
228
-
229
-
230
-
231
-
232
-
233
-
234
-
235
-
236
-
237
-
238
-
 239
239 -
 240
240 -
 241
241 -
 242
242 -
 243
243 -
 244
244 -
 245
245 -
 246
246 -
 247
247 -
 248
248 -
 249
249 -
 250
250 -
 251
251 -
 252
252 -
 253
253 -
 254
254 -
 255
255 -
 256
256 -
 257
257 -
 258
258 -
 259
259 -
260
-
261
-
262
-
263
-
264
-
265
-
266
-
267
-
268
 |
 |

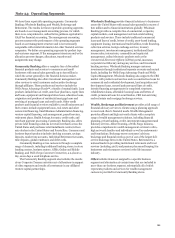
The methods described above may produce a fair value
calculation that may not be indicative of net realizable value or
reflective of future fair values. While we believe our valuation
methods are appropriate and consistent with other market
participants, the use of different methodologies or assumptions
to determine the fair value of certain financial instruments could
result in a different fair value measurement at the reporting
date.
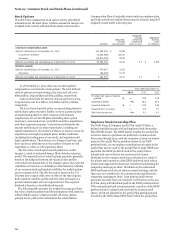
Defined Contribution Retirement Plans
We sponsor a defined contribution retirement plan named the
Wells Fargo & Company 401(k) Plan (401(k) Plan). Under the
401(k) Plan, after one month of service, eligible employees may
contribute up to 50% of their certified compensation, subject to
statutory limits. Eligible employees who complete one year of
service are eligible for company matching contributions, which
are generally dollar for dollar up to 6% of an employee's eligible
certified compensation. Effective January 1, 2010, matching
contributions are 100% vested. The 401(k) Plan includes an
employer discretionary profit sharing contribution feature to
allow us to make a contribution to eligible employees’ 401(k)
Plan accounts. Eligible employees who complete one year of
service are eligible for profit sharing contributions. Profit
sharing contributions are vested after three years of service.
Total defined contribution retirement plan expenses were $1.1
billion, $1.2 billion, and $1.1 billion in 2014, 2013, and 2012
respectively.
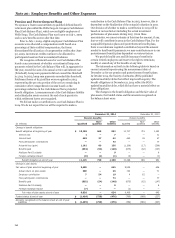
Other Expenses
Expenses exceeding 1% of total interest income and noninterest
income in any of the years presented that are not otherwise
shown separately in the financial statements or Notes to
Financial Statements were:
Year ended December 31,
(in millions) 2014 2013 2012
Outside professional services $ 2,689 2,519 2,729
Operating losses 1,249 821 2,235
Outside data processing 1,034 983 910
Contract services 975 935 1,011
Travel and entertainment 904 885 839
Foreclosed assets 583 605 1,061
247