Wells Fargo 2014 Annual Report Download - page 43
Download and view the complete annual report
Please find page 43 of the 2014 Wells Fargo annual report below. You can navigate through the pages in the report by either clicking on the pages listed below, or by using the keyword search tool below to find specific information within the annual report.-
 1
1 -
2
-
3
-
4
-
5
-
6
-
7
-
8
-
9
-
10
-
11
-
12
-
13
-
14
-
15
-
16
-
17
-
18
-
19
-
20
-
21
-
22
-
23
-
24
-
25
-
26
-
27
-
28
-
29
-
30
-
31
-
32
-
 33
33 -
 34
34 -
 35
35 -
 36
36 -
 37
37 -
 38
38 -
 39
39 -
 40
40 -
 41
41 -
 42
42 -
 43
43 -
 44
44 -
 45
45 -
 46
46 -
 47
47 -
 48
48 -
 49
49 -
 50
50 -
 51
51 -
 52
52 -
 53
53 -
54
-
55
-
56
-
57
-
58
-
59
-
60
-
61
-
62
-
63
-
64
-
65
-
66
-
67
-
68
-
69
-
70
-
71
-
72
-
73
-
74
-
75
-
76
-
77
-
78
-
79
-
80
-
81
-
82
-
83
-
84
-
85
-
86
-
87
-
88
-
89
-
90
-
91
-
92
-
93
-
94
-
95
-
96
-
97
-
98
-
99
-
100
-
101
-
102
-
103
-
104
-
105
-
106
-
107
-
108
-
109
-
110
-
111
-
112
-
113
-
114
-
115
-
116
-
117
-
118
-
119
-
120
-
121
-
122
-
123
-
124
-
125
-
126
-
127
-
128
-
129
-
130
-
131
-
132
-
133
-
134
-
135
-
136
-
137
-
138
-
139
-
140
-
141
-
142
-
143
-
144
-
145
-
146
-
147
-
148
-
149
-
150
-
151
-
152
-
153
-
154
-
155
-
156
-
157
-
158
-
159
-
160
-
161
-
162
-
163
-
164
-
165
-
166
-
167
-
168
-
169
-
170
-
171
-
172
-
173
-
174
-
175
-
176
-
177
-
178
-
179
-
180
-
181
-
182
-
183
-
184
-
185
-
186
-
187
-
188
-
189
-
190
-
191
-
192
-
193
-
194
-
195
-
196
-
197
-
198
-
199
-
200
-
201
-
202
-
203
-
204
-
205
-
206
-
207
-
208
-
209
-
210
-
211
-
212
-
213
-
214
-
215
-
216
-
217
-
218
-
219
-
220
-
221
-
222
-
223
-
224
-
225
-
226
-
227
-
228
-
229
-
230
-
231
-
232
-
233
-
234
-
235
-
236
-
237
-
238
-
239
-
240
-
241
-
242
-
243
-
244
-
245
-
246
-
247
-
248
-
249
-
250
-
251
-
252
-
253
-
254
-
255
-
256
-
257
-
258
-
259
-
260
-
261
-
262
-
263
-
264
-
265
-
266
-
267
-
268
 |
 |

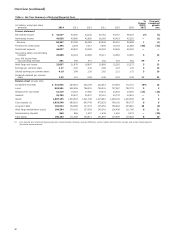
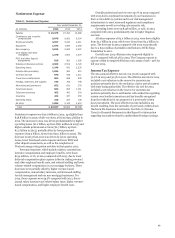
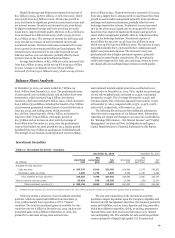
Noninterest Income
Table 7: Noninterest Income
Year ended December 31,
(in millions) 2014 2013 2012
Service charges on deposit accounts $ 5,050 5,023 4,683
Trust and investment fees:
Brokerage advisory, commissions
and other fees 9,183 8,395 7,524
Trust and investment management 3,387 3,289 3,080
Investment banking 1,710 1,746 1,286
Total trust and investment fees 14,280 13,430 11,890
Card fees 3,431 3,191 2,838
Other fees:
Charges and fees on loans 1,316 1,540 1,746
Merchant processing fees 726 669 583
Cash network fees 507 493 470
Commercial real estate
brokerage commissions 469 338 307
Letters of credit fees 390 410 441
All other fees 941 890 972
Total other fees 4,349 4,340 4,519
Mortgage banking:
Servicing income, net 3,337 1,920 1,378
Net gains on mortgage loan
origination/sales activities 3,044 6,854 10,260
Total mortgage banking 6,381 8,774 11,638
Insurance 1,655 1,814 1,850
Net gains from trading activities 1,161 1,623 1,707
Net gains (losses) on debt securities 593 (29) (128)
Net gains from equity investments 2,380 1,472 1,485
Lease income 526 663 567
Life insurance investment income 558 566 757
All other 456 113 1,050
Total $ 40,820 40,980 42,856
Noninterest income of $40.8 billion represented 48% of revenue
for 2014 compared with $41.0 billion, or 49%, for 2013 and
$42.9 billion, or 50%, for 2012. The decrease in noninterest
income in 2014 was primarily due to a decline in mortgage
banking, partially offset by growth in many of our other
businesses including debit card, corporate banking, principal
investments, asset-backed finance, equipment finance,
international, venture capital, wealth management and retail
brokerage. Excluding mortgage banking, noninterest income
increased $2.2 billion from a year ago.
Service charges on deposit accounts increased $27 million
from 2013 due to account growth, new commercial product sales
and commercial product re-pricing, partially offset by changes
we implemented in early October 2014 designed to provide
customers with more real time information to manage their
deposit accounts and avoid overdrafts. Service charges on
deposit accounts in 2013 increased $340 million, or 7%, from
2012 due to primary consumer checking customer growth,
product changes and customer adoption of overdraft services.
Brokerage advisory, commissions and other fees are
received for providing services to full-service and discount
brokerage customers. Income from these brokerage-related
activities include asset-based fees, which are based on the
market value of the customer’s assets, and transactional
commissions based on the number and size of transactions
executed at the customer’s direction. These fees increased to
$9.2 billion in 2014, from $8.4 billion and $7.5 billion in 2013
and 2012, respectively. The increase in brokerage income was
predominantly due to higher asset-based fees as a result of
higher market values and growth in assets under management,
partially offset by a decrease in brokerage transaction revenue.
Retail brokerage client assets totaled $1.42 trillion at
December 31, 2014, up 4% from $1.36 trillion at
December 31, 2013, which was up 12% from $1.22 trillion at
December 31, 2012.
We earn trust and investment management fees from
managing and administering assets, including mutual funds,
corporate trust, personal trust, employee benefit trust and
agency assets. Trust and investment management fees are
largely based on a tiered scale relative to the market value of the
assets under management or administration. These fees
increased to $3.4 billion in 2014 from $3.3 billion in 2013 and
$3.1 billion in 2012, primarily due to growth in assets under
management reflecting higher market values. At
December 31, 2014, these assets totaled $2.5 trillion, an increase
from $2.4 trillion and $2.2 trillion at December 31, 2013 and
2012, respectively.
We earn investment banking fees from underwriting debt
and equity securities, arranging loan syndications, and
performing other related advisory services. Investment banking
fees remained unchanged at $1.7 billion in 2014 compared with
2013 as higher advisory services results were offset by lower loan
syndication and origination fees. Investment banking fees
increased $460 million in 2013 compared with 2012, primarily
due to increased loan syndication volume and equity
originations.
Card fees were $3.4 billion in 2014, compared with
$3.2 billion in 2013 and $2.8 billion in 2012. Card fees increased
in 2014 and 2013 primarily due to account growth and increased
purchase activity.
Other fees of $4.3 billion in 2014 were unchanged compared
with 2013 as a decline in charges and fees on loans was offset by
an increase in commercial real estate brokerage commissions.
Other fees in 2013 declined $179 million compared with 2012
due to a decline in charges and fees on loans. Charges and fees
on loans decreased to $1.3 billion in 2014 compared with
$1.5 billion and $1.7 billion in 2013 and 2012, respectively,
primarily due to the phase out of the direct deposit advance
product during the first half of 2014. Commercial real estate
brokerage commissions increased to $469 million in 2014
compared with $338 million in 2013 and $307 million in 2012,
driven by increased sales and other property-related activities
including financing and advisory services.
Mortgage banking income, consisting of net servicing
income and net gains on loan origination/sales activities, totaled
$6.4 billion in 2014, compared with $8.8 billion in 2013 and
$11.6 billion in 2012.
In addition to servicing fees, net mortgage loan servicing
income includes amortization of commercial mortgage servicing
rights (MSRs), changes in the fair value of residential MSRs
during the period, as well as changes in the value of derivatives
(economic hedges) used to hedge the residential MSRs. Net
servicing income of $3.3 billion for 2014 included a $1.4 billion
net MSR valuation gain ($2.1 billion decrease in the fair value of
the MSRs offset by a $3.5 billion hedge gain). Net servicing
income of $1.9 billion for 2013 included a $489 million net MSR
valuation gain ($3.4 billion increase in the fair value of the MSRs
offset by a $2.9 billion hedge loss), and net servicing income of
$1.4 billion for 2012 included a $681 million net MSR valuation
gain ($2.9 billion decrease in the fair value of MSRs offset by a
$3.6 billion hedge gain). The lower net MSR valuation gain in
2013, compared with 2014, was attributable to MSR valuation
adjustments associated with higher prepayments and increases
in servicing and foreclosure costs.
Our portfolio of loans serviced for others was $1.86 trillion
at December 31, 2014, $1.90 trillion at December 31, 2013, and
$1.91 trillion at December 31, 2012. At December 31, 2014, the
ratio of MSRs to related loans serviced for others was 0.75%,
41