Wells Fargo 2014 Annual Report Download - page 245
Download and view the complete annual report
Please find page 245 of the 2014 Wells Fargo annual report below. You can navigate through the pages in the report by either clicking on the pages listed below, or by using the keyword search tool below to find specific information within the annual report.-
 1
1 -
2
-
3
-
4
-
5
-
6
-
7
-
8
-
9
-
10
-
11
-
12
-
13
-
14
-
15
-
16
-
17
-
18
-
19
-
20
-
21
-
22
-
23
-
24
-
25
-
26
-
27
-
28
-
29
-
30
-
31
-
32
-
33
-
34
-
35
-
36
-
37
-
38
-
39
-
40
-
41
-
42
-
43
-
44
-
45
-
46
-
47
-
48
-
49
-
50
-
51
-
52
-
53
-
54
-
55
-
56
-
57
-
58
-
59
-
60
-
61
-
62
-
63
-
64
-
65
-
66
-
67
-
68
-
69
-
70
-
71
-
72
-
73
-
74
-
75
-
76
-
77
-
78
-
79
-
80
-
81
-
82
-
83
-
84
-
85
-
86
-
87
-
88
-
89
-
90
-
91
-
92
-
93
-
94
-
95
-
96
-
97
-
98
-
99
-
100
-
101
-
102
-
103
-
104
-
105
-
106
-
107
-
108
-
109
-
110
-
111
-
112
-
113
-
114
-
115
-
116
-
117
-
118
-
119
-
120
-
121
-
122
-
123
-
124
-
125
-
126
-
127
-
128
-
129
-
130
-
131
-
132
-
133
-
134
-
135
-
136
-
137
-
138
-
139
-
140
-
141
-
142
-
143
-
144
-
145
-
146
-
147
-
148
-
149
-
150
-
151
-
152
-
153
-
154
-
155
-
156
-
157
-
158
-
159
-
160
-
161
-
162
-
163
-
164
-
165
-
166
-
167
-
168
-
169
-
170
-
171
-
172
-
173
-
174
-
175
-
176
-
177
-
178
-
179
-
180
-
181
-
182
-
183
-
184
-
185
-
186
-
187
-
188
-
189
-
190
-
191
-
192
-
193
-
194
-
195
-
196
-
197
-
198
-
199
-
200
-
201
-
202
-
203
-
204
-
205
-
206
-
207
-
208
-
209
-
210
-
211
-
212
-
213
-
214
-
215
-
216
-
217
-
218
-
219
-
220
-
221
-
222
-
223
-
224
-
225
-
226
-
227
-
228
-
229
-
230
-
231
-
232
-
233
-
234
-
 235
235 -
 236
236 -
 237
237 -
 238
238 -
 239
239 -
 240
240 -
 241
241 -
 242
242 -
 243
243 -
 244
244 -
 245
245 -
 246
246 -
 247
247 -
 248
248 -
 249
249 -
 250
250 -
 251
251 -
 252
252 -
 253
253 -
 254
254 -
 255
255 -
256
-
257
-
258
-
259
-
260
-
261
-
262
-
263
-
264
-
265
-
266
-
267
-
268
 |
 |

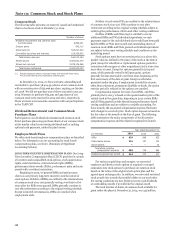
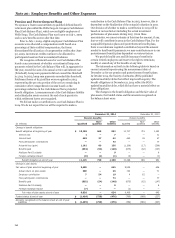
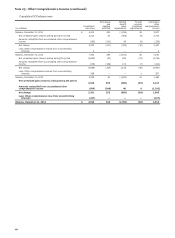
The following table provides information for pension plans
with benefit obligations in excess of plan assets.
Dec 31, Dec 31,
(in millions) 2014 2013
Projected benefit obligation $ 11,855 10,822
Accumulated benefit obligation 11,851 10,820
Fair value of plan assets 9,626 9,364
The components of net periodic benefit cost and other
comprehensive income were:
December 31, 2014 December 31, 2013 December 31, 2012
Pension benefits Pension benefits Pension benefits
Non- Other Non- Other Non- Other
(in millions) Qualified qualified benefits Qualified qualified benefits Qualified qualified benefits
Service cost $ 1 — 7 — — 11 3 — 11
Interest cost 465 27 42 465 29 47 514 32 60
Expected return on plan assets (629) — (36) (674) — (36) (652) — (36)
Amortization of net actuarial loss
(gain) 91 11 (28) 137 15 (1) 131 10 —
Amortization of prior service
credit — — (2) — — (2) — — (2)
Settlement loss (1) — 2 — 124 3 — 2 5 —
Curtailment gain — — — — — — — — (3)
Net periodic benefit cost (72) 40 (17) 52 47 19 (2) 47
Other changes in plan assets and
benefit obligations recognized
in other comprehensive
income:
Net actuarial loss (gain) 881 89 146 (1,175) (17) (341) 758 62 (42)
Amortization of net actuarial gain
(loss) (91) (11) 28 (137) (15) 1 (131) (10) —
Prior service cost — — — — — — (2) — —
Amortization of prior service
credit — — 2 — — 2 — — 2
Settlement (1) — (2) — (124) (3) — (1) (5) —
Total recognized in other
comprehensive income 790 76 176 (1,436) (35) (338) 624 47 (40)
Total recognized in net periodic
benefit cost and other
comprehensive income $ 718 116 159 (1,384) 12 (319) 622 94 (10)
(1) Qualified settlements in 2013 include $123 million for the Cash Balance Plan.
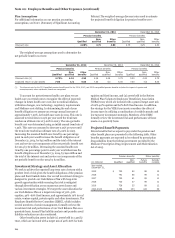
Amounts recognized in cumulative OCI (pre tax) consist of:
December 31, 2014 December 31, 2013
Pension benefits Pension benefits
Non- Other Non- Other
(in millions) Qualified qualified benefits Qualified qualified benefits
Net actuarial loss (gain) $ 2,677 224 (147) 1,887 148 (321)
Net prior service credit (2) — (20) (2) — (22)
Total $ 2,675 224 (167) 1,885 148 (343)
The net actuarial loss for the defined benefit pension plans
and other post retirement plans that will be amortized from
cumulative OCI into net periodic benefit cost in 2015 is
$122 million. The net prior service credit for the defined benefit
pension plans and other post retirement plans that will be
amortized from cumulative OCI into net periodic benefit cost in
2015 is $2 million.
30
243