Wells Fargo 2014 Annual Report Download - page 73
Download and view the complete annual report
Please find page 73 of the 2014 Wells Fargo annual report below. You can navigate through the pages in the report by either clicking on the pages listed below, or by using the keyword search tool below to find specific information within the annual report.-
 1
1 -
2
-
3
-
4
-
5
-
6
-
7
-
8
-
9
-
10
-
11
-
12
-
13
-
14
-
15
-
16
-
17
-
18
-
19
-
20
-
21
-
22
-
23
-
24
-
25
-
26
-
27
-
28
-
29
-
30
-
31
-
32
-
33
-
34
-
35
-
36
-
37
-
38
-
39
-
40
-
41
-
42
-
43
-
44
-
45
-
46
-
47
-
48
-
49
-
50
-
51
-
52
-
53
-
54
-
55
-
56
-
57
-
58
-
59
-
60
-
61
-
62
-
 63
63 -
 64
64 -
 65
65 -
 66
66 -
 67
67 -
 68
68 -
 69
69 -
 70
70 -
 71
71 -
 72
72 -
 73
73 -
 74
74 -
 75
75 -
 76
76 -
 77
77 -
 78
78 -
 79
79 -
 80
80 -
 81
81 -
 82
82 -
 83
83 -
84
-
85
-
86
-
87
-
88
-
89
-
90
-
91
-
92
-
93
-
94
-
95
-
96
-
97
-
98
-
99
-
100
-
101
-
102
-
103
-
104
-
105
-
106
-
107
-
108
-
109
-
110
-
111
-
112
-
113
-
114
-
115
-
116
-
117
-
118
-
119
-
120
-
121
-
122
-
123
-
124
-
125
-
126
-
127
-
128
-
129
-
130
-
131
-
132
-
133
-
134
-
135
-
136
-
137
-
138
-
139
-
140
-
141
-
142
-
143
-
144
-
145
-
146
-
147
-
148
-
149
-
150
-
151
-
152
-
153
-
154
-
155
-
156
-
157
-
158
-
159
-
160
-
161
-
162
-
163
-
164
-
165
-
166
-
167
-
168
-
169
-
170
-
171
-
172
-
173
-
174
-
175
-
176
-
177
-
178
-
179
-
180
-
181
-
182
-
183
-
184
-
185
-
186
-
187
-
188
-
189
-
190
-
191
-
192
-
193
-
194
-
195
-
196
-
197
-
198
-
199
-
200
-
201
-
202
-
203
-
204
-
205
-
206
-
207
-
208
-
209
-
210
-
211
-
212
-
213
-
214
-
215
-
216
-
217
-
218
-
219
-
220
-
221
-
222
-
223
-
224
-
225
-
226
-
227
-
228
-
229
-
230
-
231
-
232
-
233
-
234
-
235
-
236
-
237
-
238
-
239
-
240
-
241
-
242
-
243
-
244
-
245
-
246
-
247
-
248
-
249
-
250
-
251
-
252
-
253
-
254
-
255
-
256
-
257
-
258
-
259
-
260
-
261
-
262
-
263
-
264
-
265
-
266
-
267
-
268
 |
 |

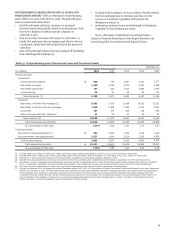
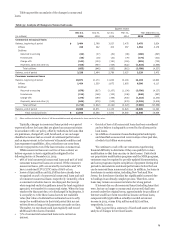
serviced by us adjusted for any observed differences in but are in their revolving period, reflects the inherent loss where
delinquency and loss rates associated with junior lien mortgages the borrower is delinquent on the corresponding first lien
behind third party first mortgages. We incorporate this inherent mortgage loans.
loss content into our allowance for loan losses. Our allowance Table 28 summarizes delinquency and loss rates for our
process for junior liens ensures consideration of the relative junior lien mortgages by the holder of the first lien.
difference in loss experience for junior liens behind first lien
mortgage loans we own or service, compared with those behind
first lien mortgage loans owned or serviced by third parties. In
addition, our allowance process for junior liens that are current,
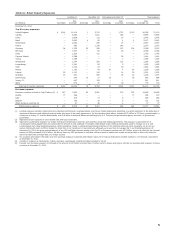
Table 28: Junior Lien Mortgage Portfolios Performance by Holder of 1st Lien (1)
% of loans
two payments
Outstanding balance or more past due
Dec 31, Dec 31, Dec 31, Dec 31, Dec 31, Sep 30,
(in millions) 2014 2013 2014 2013 2014 2014
Junior lien mortgages behind:
Wells Fargo owned or serviced first
lien $ 29,483 32,695 2.39% 2.37 0.89 0.86
Third party first lien 30,133 33,132 2.58 2.53 0.88 0.94
Total junior lien mortgages $ 59,616 65,827 2.49% 2.45 0.88 0.90
Jun 30,
2014
1.08
0.96
1.02
Loss rate
(annualized)
quarter ended
Mar 31, Dec 31,
2014 2013
1.16 1.34
1.23 1.35
1.20 1.35
(1) Excludes PCI loans because their losses were generally reflected in PCI accounting adjustments at the date of acquisition.
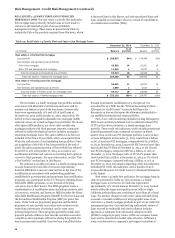
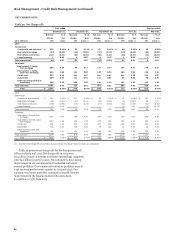
We monitor the number of borrowers paying the minimum
amount due on a monthly basis. In December 2014,
approximately 94% of our borrowers with a junior lien mortgage
outstanding balance paid the minimum amount due or more,
including approximately 47% who paid only the minimum
amount due.
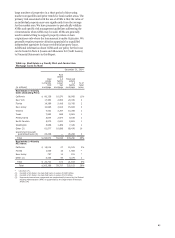
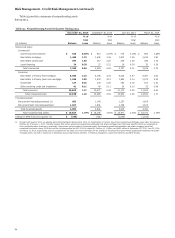
Table 29 shows the credit attributes of the core and
liquidating junior lien mortgage portfolios and lists the top five
states by outstanding balance for the core portfolio. Loans to
California borrowers represent the largest state concentration in
each of these portfolios. The decrease in outstanding balances
since December 31, 2013 predominantly reflects loan paydowns.
As of December 31, 2014, 20% of the outstanding balance of the
junior lien mortgage portfolio was associated with loans that had
Table 29: Junior Lien Mortgage Portfolios (1)
a combined loan to value (CLTV) ratio in excess of 100%. Of
those junior mortgage liens with a CLTV ratio in excess of 100%,
3.03% were two payments or more past due as of
December 31, 2014. CLTV means the ratio of the total loan
balance of first mortgages and junior lien mortgages (including
unused line amounts for credit line products) to property
collateral value. The unsecured portion (the outstanding amount
that was in excess of the most recent property collateral value) of
the outstanding balances of these loans totaled 8% of the junior
lien mortgage portfolio at December 31, 2014.
% of loans
Outstanding balance
two payments
or more past due Loss rate
(in millions)
Core portfolio
California
Florida
New Jersey
Virginia
Pennsylvania
Other
$
Dec 31,
2014
15,535
5,283
4,705
3,160
2,942
25,006
Dec 31,
2013
17,003
5,811
5,019
3,378
3,137
27,689
Dec 31,
2014
2.07%
2.96
3.43
2.18
2.72
2.20
Dec 31,
2013
2.03
3.16
3.43
2.02
2.64
2.18
Year ended December 31,
2014 2013
0.48 1.52
1.40 2.60
1.42 1.79
0.84 1.19
1.11 1.29
0.95 1.69
Total 56,631 62,037 2.36 2.35 0.90 1.69
Liquidating portfolio 2,985 3,790 4.77 4.10 2.74 4.50
Total core and liquidating portfolios $ 59,616 65,827 2.49% 2.45 1.00 1.86
(1) Excludes PCI loans because their losses were generally reflected in PCI accounting adjustments at the date of acquisition.
Our junior lien, as well as first lien, lines of credit products the draw period of (1) interest only or (2) 1.5% of outstanding
generally have a draw period of 10 years (with some up to 15 or principal balance plus accrued interest. During the draw period,
20 years) with variable interest rate and payment options during the borrower has the option of converting all or a portion of the
71