Wells Fargo 2014 Annual Report Download - page 169
Download and view the complete annual report
Please find page 169 of the 2014 Wells Fargo annual report below. You can navigate through the pages in the report by either clicking on the pages listed below, or by using the keyword search tool below to find specific information within the annual report.-
 1
1 -
2
-
3
-
4
-
5
-
6
-
7
-
8
-
9
-
10
-
11
-
12
-
13
-
14
-
15
-
16
-
17
-
18
-
19
-
20
-
21
-
22
-
23
-
24
-
25
-
26
-
27
-
28
-
29
-
30
-
31
-
32
-
33
-
34
-
35
-
36
-
37
-
38
-
39
-
40
-
41
-
42
-
43
-
44
-
45
-
46
-
47
-
48
-
49
-
50
-
51
-
52
-
53
-
54
-
55
-
56
-
57
-
58
-
59
-
60
-
61
-
62
-
63
-
64
-
65
-
66
-
67
-
68
-
69
-
70
-
71
-
72
-
73
-
74
-
75
-
76
-
77
-
78
-
79
-
80
-
81
-
82
-
83
-
84
-
85
-
86
-
87
-
88
-
89
-
90
-
91
-
92
-
93
-
94
-
95
-
96
-
97
-
98
-
99
-
100
-
101
-
102
-
103
-
104
-
105
-
106
-
107
-
108
-
109
-
110
-
111
-
112
-
113
-
114
-
115
-
116
-
117
-
118
-
119
-
120
-
121
-
122
-
123
-
124
-
125
-
126
-
127
-
128
-
129
-
130
-
131
-
132
-
133
-
134
-
135
-
136
-
137
-
138
-
139
-
140
-
141
-
142
-
143
-
144
-
145
-
146
-
147
-
148
-
149
-
150
-
151
-
152
-
153
-
154
-
155
-
156
-
157
-
158
-
 159
159 -
 160
160 -
 161
161 -
 162
162 -
 163
163 -
 164
164 -
 165
165 -
 166
166 -
 167
167 -
 168
168 -
 169
169 -
 170
170 -
 171
171 -
 172
172 -
 173
173 -
 174
174 -
 175
175 -
 176
176 -
 177
177 -
 178
178 -
 179
179 -
180
-
181
-
182
-
183
-
184
-
185
-
186
-
187
-
188
-
189
-
190
-
191
-
192
-
193
-
194
-
195
-
196
-
197
-
198
-
199
-
200
-
201
-
202
-
203
-
204
-
205
-
206
-
207
-
208
-
209
-
210
-
211
-
212
-
213
-
214
-
215
-
216
-
217
-
218
-
219
-
220
-
221
-
222
-
223
-
224
-
225
-
226
-
227
-
228
-
229
-
230
-
231
-
232
-
233
-
234
-
235
-
236
-
237
-
238
-
239
-
240
-
241
-
242
-
243
-
244
-
245
-
246
-
247
-
248
-
249
-
250
-
251
-
252
-
253
-
254
-
255
-
256
-
257
-
258
-
259
-
260
-
261
-
262
-
263
-
264
-
265
-
266
-
267
-
268
 |
 |

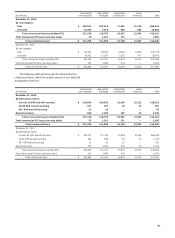
Real estate Real estate Other
1-4 family 1-4 family revolving
first junior lien credit and
(in millions) mortgage mortgage Credit card Automobile installment Total
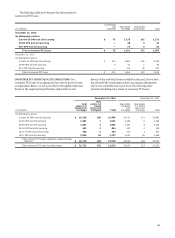
December 31, 2014
By updated FICO:
< 600 $ 11,166 4,001 2,639 8,825 894 27,525
600-639 7,866 2,794 2,588 6,236 1,058 20,542
640-679 13,894 5,324 4,931 9,352 2,366 35,867
680-719 24,412 8,970 6,285 9,994 4,389 54,050
720-759 35,490 12,171 6,407 7,475 5,896 67,439
760-799 82,123 17,897 5,234 7,315 7,673 120,242
800+ 39,219 7,581 2,758 6,184 5,819 61,561
No FICO available 3,236 878 277 359 1,814 6,564
FICO not required — — — — 5,854 5,854
Government insured/guaranteed loans (1) 26,268 — — — — 26,268
Total consumer loans (excluding PCI) 243,674 59,616 31,119 55,740 35,763 425,912
Total consumer PCI loans (carrying value) 21,712 101 — — — 21,813
Total consumer loans $ 265,386 59,717 31,119 55,740 35,763 447,725
December 31, 2013
By updated FICO:
< 600 $ 14,128 5,047 2,404 8,400 956 30,935
600-639 9,029 3,247 2,175 5,925 1,015 21,391
640-679 14,918 5,985 4,176 8,827 2,158 36,064
680-719 24,336 10,043 5,398 8,992 3,917 52,686
720-759 32,991 13,581 5,530 6,546 5,264 63,912
760-799 72,062 19,238 4,535 6,313 6,836 108,984
800+ 33,310 7,707 2,409 5,397 5,130 53,953
No FICO available 2,896 979 255 408 2,054 6,592
FICO not required — — — — 5,007 5,007
Government insured/guaranteed loans (1) 30,737 — — — 10,712 41,449
Total consumer loans (excluding PCI) 234,407 65,827 26,882 50,808 43,049 420,973
Total consumer PCI loans (carrying value) 24,100 123 — — — 24,223
Total consumer loans $ 258,507 65,950 26,882 50,808 43,049 445,196
(1) Represents loans whose repayments are predominantly insured by the FHA or guaranteed by the VA and student loans whose repayments are predominantly guaranteed by
agencies on behalf of the U.S. Department of Education under FFELP.
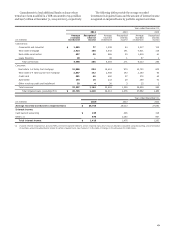
LTV refers to the ratio comparing the loan’s unpaid
principal balance to the property’s collateral value. CLTV refers
to the combination of first mortgage and junior lien mortgage
(including unused line amounts for credit line products) ratios.
LTVs and CLTVs are updated quarterly using a cascade approach
which first uses values provided by automated valuation models
(AVMs) for the property. If an AVM is not available, then the
value is estimated using the original appraised value adjusted by
the change in Home Price Index (HPI) for the property location.
If an HPI is not available, the original appraised value is used.
The HPI value is normally the only method considered for high
value properties, generally with an original value of $1 million or
more, as the AVM values have proven less accurate for these
properties.
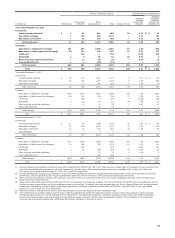
The following table shows the most updated LTV and CLTV
distribution of the real estate 1-4 family first and junior lien
mortgage loan portfolios. We consider the trends in residential
real estate markets as we monitor credit risk and establish our
allowance for credit losses. In the event of a default, any loss
should be limited to the portion of the loan amount in excess of
the net realizable value of the underlying real estate collateral
value. Certain loans do not have an LTV or CLTV primarily due
to industry data availability and portfolios acquired from or
serviced by other institutions.
167