Wells Fargo 2014 Annual Report Download - page 140
Download and view the complete annual report
Please find page 140 of the 2014 Wells Fargo annual report below. You can navigate through the pages in the report by either clicking on the pages listed below, or by using the keyword search tool below to find specific information within the annual report.-
 1
1 -
2
-
3
-
4
-
5
-
6
-
7
-
8
-
9
-
10
-
11
-
12
-
13
-
14
-
15
-
16
-
17
-
18
-
19
-
20
-
21
-
22
-
23
-
24
-
25
-
26
-
27
-
28
-
29
-
30
-
31
-
32
-
33
-
34
-
35
-
36
-
37
-
38
-
39
-
40
-
41
-
42
-
43
-
44
-
45
-
46
-
47
-
48
-
49
-
50
-
51
-
52
-
53
-
54
-
55
-
56
-
57
-
58
-
59
-
60
-
61
-
62
-
63
-
64
-
65
-
66
-
67
-
68
-
69
-
70
-
71
-
72
-
73
-
74
-
75
-
76
-
77
-
78
-
79
-
80
-
81
-
82
-
83
-
84
-
85
-
86
-
87
-
88
-
89
-
90
-
91
-
92
-
93
-
94
-
95
-
96
-
97
-
98
-
99
-
100
-
101
-
102
-
103
-
104
-
105
-
106
-
107
-
108
-
109
-
110
-
111
-
112
-
113
-
114
-
115
-
116
-
117
-
118
-
119
-
120
-
121
-
122
-
123
-
124
-
125
-
126
-
127
-
128
-
129
-
 130
130 -
 131
131 -
 132
132 -
 133
133 -
 134
134 -
 135
135 -
 136
136 -
 137
137 -
 138
138 -
 139
139 -
 140
140 -
 141
141 -
 142
142 -
 143
143 -
 144
144 -
 145
145 -
 146
146 -
 147
147 -
 148
148 -
 149
149 -
 150
150 -
151
-
152
-
153
-
154
-
155
-
156
-
157
-
158
-
159
-
160
-
161
-
162
-
163
-
164
-
165
-
166
-
167
-
168
-
169
-
170
-
171
-
172
-
173
-
174
-
175
-
176
-
177
-
178
-
179
-
180
-
181
-
182
-
183
-
184
-
185
-
186
-
187
-
188
-
189
-
190
-
191
-
192
-
193
-
194
-
195
-
196
-
197
-
198
-
199
-
200
-
201
-
202
-
203
-
204
-
205
-
206
-
207
-
208
-
209
-
210
-
211
-
212
-
213
-
214
-
215
-
216
-
217
-
218
-
219
-
220
-
221
-
222
-
223
-
224
-
225
-
226
-
227
-
228
-
229
-
230
-
231
-
232
-
233
-
234
-
235
-
236
-
237
-
238
-
239
-
240
-
241
-
242
-
243
-
244
-
245
-
246
-
247
-
248
-
249
-
250
-
251
-
252
-
253
-
254
-
255
-
256
-
257
-
258
-
259
-
260
-
261
-
262
-
263
-
264
-
265
-
266
-
267
-
268
 |
 |

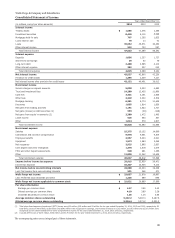
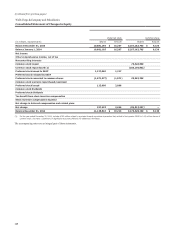
Wells Fargo & Company and Subsidiaries
Consolidated Statement of Cash Flows
Year ended December 31,
(in millions) 2014 2013 2012
Cash flows from operating activities:
Net income before noncontrolling interests $ 23,608 22,224 19,368
Adjustments to reconcile net income to net cash provided by operating activities:
Provision for credit losses 1,395 2,309 7,217
Changes in fair value of MSRs, MHFS and LHFS carried at fair value 1,820 (3,229) (2,307)
Depreciation, amortization and accretion 2,515 3,293 2,807
Other net gains (3,760) (9,384) (3,661)
Stock-based compensation 1,912 1,920 1,698
Excess tax benefits related to stock incentive compensation (453) (271) (226)
Originations of MHFS (144,812) (317,054) (483,835)
Proceeds from sales of and principal collected on mortgages originated for sale 117,097 311,431 421,623
Originations of LHFS — — (15)
Proceeds from sales of and principal collected on LHFS 207 575 9,383
Purchases of LHFS (154) (291) (7,975)
Net change in:
Trading assets 11,186 43,638 105,440
Deferred income taxes 2,354 4,977 (1,297)
Accrued interest receivable (372) (13) 293
Accrued interest payable 119 (32) (84)
Other assets (10,681) 4,693 2,064
Other accrued expenses and liabilities 15,548 (7,145) (11,953)
Net cash provided by operating activities 17,529 57,641 58,540
Cash flows from investing activities:
Net change in:
Federal funds sold, securities purchased under resale agreements and other short-term investments (41,778) (78,184) (92,946)
Available-for-sale securities:
Sales proceeds 6,089 2,837 5,210
Prepayments and maturities 37,257 50,737 59,712
Purchases (44,807) (89,474) (64,756)
Held-to-maturity securities:
Paydowns and maturities 5,168 30 —
Purchases (47,012) (5,782) —
Nonmarketable equity investments:
Sales proceeds 3,161 2,577 2,279
Purchases (3,087) (3,273) (2,619)
Loans:
Loans originated by banking subsidiaries, net of principal collected (65,162) (43,744) (53,381)
Proceeds from sales (including participations) of loans originated for investment 21,564 7,694 6,811
Purchases (including participations) of loans (6,424) (11,563) (9,040)
Principal collected on nonbank entities' loans 13,589 19,955 25,080
Loans originated by nonbank entities (13,570) (17,311) (23,555)
Net cash paid for acquisitions (174) — (4,322)
Proceeds from sales of foreclosed assets and short sales (1) 7,697 11,021 12,690
Net cash from purchases and sales of MSRs (150) 407 116
Other, net (741) 581 (1,169)
Net cash used by investing activities (128,380) (153,492) (139,890)
Cash flows from financing activities:
Net change in:
Deposits 89,133 76,342 82,762
Short-term borrowings 8,035 (3,390) 7,699
Long-term debt:
Proceeds from issuance 42,154 53,227 27,695
Repayment (15,829) (25,423) (28,093)
Preferred stock:
Proceeds from issuance 2,775 3,145 1,377
Cash dividends paid (1,235) (1,017) (892)
Common stock:
Proceeds from issuance 1,840 2,224 2,091
Repurchased (9,414) (5,356) (3,918)
Cash dividends paid (6,908) (5,953) (4,565)
Common stock warrants repurchased — — (1)
Excess tax benefits related to stock incentive compensation 453 271 226
Net change in noncontrolling interests (552) (296) (611)
Other, net 51 136 —
Net cash provided by financing activities 110,503 93,910 83,770
Net change in cash due from banks (348) (1,941) 2,420
Cash and due from banks at beginning of year 19,919 21,860 19,440
Cash and due from banks at end of year $ 19,571 19,919 21,860
Supplemental cash flow disclosures:
Cash paid for interest $ 3,906 4,321 5,245
Cash paid for income taxes 8,808 7,132 8,024
(1) Includes proceeds received for the settlement of claims on certain government guaranteed residential real estate mortgage loans in foreclosure that are reported as
accounts receivables. During fourth quarter 2014, we adopted Accounting Standards Update (ASU) 2014-14, Classification of Certain Government-Guaranteed Mortgage
Loans Upon Foreclosure, effective as of January 1, 2014. This ASU requires that certain government guaranteed residential real estate mortgage loans be recognized as
other receivables upon foreclosure; previously, these were included in foreclosed assets.
The accompanying notes are an integral part of these statements. See Note 1 (Summary of Significant Accounting Policies) for noncash activities.
138