Wells Fargo 2014 Annual Report Download - page 163
Download and view the complete annual report
Please find page 163 of the 2014 Wells Fargo annual report below. You can navigate through the pages in the report by either clicking on the pages listed below, or by using the keyword search tool below to find specific information within the annual report.-
 1
1 -
2
-
3
-
4
-
5
-
6
-
7
-
8
-
9
-
10
-
11
-
12
-
13
-
14
-
15
-
16
-
17
-
18
-
19
-
20
-
21
-
22
-
23
-
24
-
25
-
26
-
27
-
28
-
29
-
30
-
31
-
32
-
33
-
34
-
35
-
36
-
37
-
38
-
39
-
40
-
41
-
42
-
43
-
44
-
45
-
46
-
47
-
48
-
49
-
50
-
51
-
52
-
53
-
54
-
55
-
56
-
57
-
58
-
59
-
60
-
61
-
62
-
63
-
64
-
65
-
66
-
67
-
68
-
69
-
70
-
71
-
72
-
73
-
74
-
75
-
76
-
77
-
78
-
79
-
80
-
81
-
82
-
83
-
84
-
85
-
86
-
87
-
88
-
89
-
90
-
91
-
92
-
93
-
94
-
95
-
96
-
97
-
98
-
99
-
100
-
101
-
102
-
103
-
104
-
105
-
106
-
107
-
108
-
109
-
110
-
111
-
112
-
113
-
114
-
115
-
116
-
117
-
118
-
119
-
120
-
121
-
122
-
123
-
124
-
125
-
126
-
127
-
128
-
129
-
130
-
131
-
132
-
133
-
134
-
135
-
136
-
137
-
138
-
139
-
140
-
141
-
142
-
143
-
144
-
145
-
146
-
147
-
148
-
149
-
150
-
151
-
152
-
 153
153 -
 154
154 -
 155
155 -
 156
156 -
 157
157 -
 158
158 -
 159
159 -
 160
160 -
 161
161 -
 162
162 -
 163
163 -
 164
164 -
 165
165 -
 166
166 -
 167
167 -
 168
168 -
 169
169 -
 170
170 -
 171
171 -
 172
172 -
 173
173 -
174
-
175
-
176
-
177
-
178
-
179
-
180
-
181
-
182
-
183
-
184
-
185
-
186
-
187
-
188
-
189
-
190
-
191
-
192
-
193
-
194
-
195
-
196
-
197
-
198
-
199
-
200
-
201
-
202
-
203
-
204
-
205
-
206
-
207
-
208
-
209
-
210
-
211
-
212
-
213
-
214
-
215
-
216
-
217
-
218
-
219
-
220
-
221
-
222
-
223
-
224
-
225
-
226
-
227
-
228
-
229
-
230
-
231
-
232
-
233
-
234
-
235
-
236
-
237
-
238
-
239
-
240
-
241
-
242
-
243
-
244
-
245
-
246
-
247
-
248
-
249
-
250
-
251
-
252
-
253
-
254
-
255
-
256
-
257
-
258
-
259
-
260
-
261
-
262
-
263
-
264
-
265
-
266
-
267
-
268
 |
 |

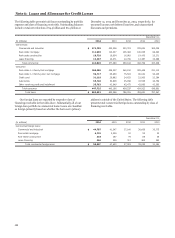
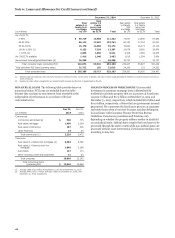
Loan Concentrations
Loan concentrations may exist when there are amounts loaned
to borrowers engaged in similar activities or similar types of
loans extended to a diverse group of borrowers that would cause
them to be similarly impacted by economic or other conditions.
At December 31, 2014 and 2013, we did not have concentrations
representing 10% or more of our total loan portfolio in domestic
commercial and industrial loans and lease financing by industry
or CRE loans (real estate mortgage and real estate construction)
by state or property type. Our real estate 1-4 family mortgage
loans to borrowers in the state of California represented
approximately 13% of total loans at both December 31, 2014
and 2013, of which 2% were PCI loans in both years. These
California loans are generally diversified among the larger
metropolitan areas in California, with no single area consisting
of more than 4% of total loans. We continuously monitor
changes in real estate values and underlying economic or market
conditions for all geographic areas of our real estate 1-4 family
mortgage portfolio as part of our credit risk management
process.
Some of our real estate 1-4 family first and junior lien
mortgage loans include an interest-only feature as part of the
loan terms. These interest-only loans were approximately 12% of
total loans at December 31, 2014, and 15% at December 31, 2013.
Substantially all of these interest-only loans at origination were
considered to be prime or near prime. We do not offer option
adjustable-rate mortgage (ARM) products, nor do we offer
variable-rate mortgage products with fixed payment amounts,
commonly referred to within the financial services industry as
negative amortizing mortgage loans. We acquired an option
payment loan portfolio (Pick-a-Pay) from Wachovia at
December 31, 2008. A majority of the portfolio was identified as
PCI loans. Since the acquisition, we have reduced our exposure
to the option payment portion of the portfolio through our
modification efforts and loss mitigation actions. At
December 31, 2014, approximately 2% of total loans remained
with the payment option feature compared with 10% at
December 31, 2008.
Our first and junior lien lines of credit products generally
have a draw period of 10 years (with some up to 15 or 20 years)
with variable interest rate and payment options during the draw
period of (1) interest only or (2) 1.5% of total outstanding
balance plus accrued interest. During the draw period, the
borrower has the option of converting all or a portion of the line
from a variable interest rate to a fixed rate with terms including
interest-only payments for a fixed period between three to seven
years or a fully amortizing payment with a fixed period between
five to 30 years. At the end of the draw period, a line of credit
generally converts to an amortizing payment schedule with
repayment terms of up to 30 years based on the balance at time
of conversion. At December 31, 2014, our lines of credit portfolio
had an outstanding balance of $69.7 billion, of which
$6.2 billion, or 9%, is in its amortization period, another
$13.3 billion, or 19%, of our total outstanding balance, will reach
their end of draw period during 2015 through 2016,
$14.2 billion, or 20%, during 2017 through 2019, and
$36.0 billion, or 52%, will convert in subsequent years. This
portfolio had unfunded credit commitments of $70.1 billion at
December 31, 2014. The lines that enter their amortization
period may experience higher delinquencies and higher loss
rates than the ones in their draw period. At December 31, 2014,
$425 million, or 7%, of outstanding lines of credit that are in
their amortization period were 30 or more days past due,
compared with $1.3 billion, or 2%, for lines in their draw period.
We have considered this increased inherent risk in our allowance
for credit loss estimate. In anticipation of our borrowers
reaching the end of their contractual commitment, we have
created a program to inform, educate and help these borrowers
transition from interest-only to fully-amortizing payments or full
repayment. We monitor the performance of the borrowers
moving through the program in an effort to refine our ongoing
program strategy.
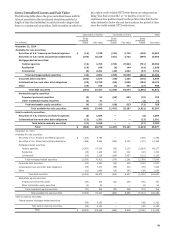
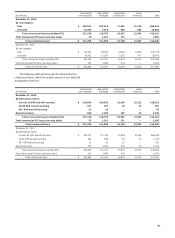
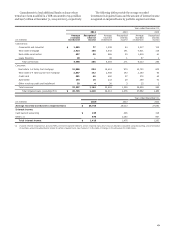
Loan Purchases, Sales, and Transfers
The following table summarizes the proceeds paid or received for
purchases and sales of loans and transfers from loans held for
investment to mortgages/loans held for sale at lower of cost or
fair value. This loan activity primarily includes loans purchased
and sales of whole loan or participating interests, whereby we
receive or transfer a portion of a loan after origination. The table
excludes PCI loans and loans recorded at fair value, including
loans originated for sale because their loan activity normally
does not impact the allowance for credit losses.
Year ended December 31,
2014 2013
(in millions) Commercial Consumer Total Commercial Consumer Total
Purchases (1) $ 4,952 1,365 6,317 10,914 581 11,495
Sales (1,706) (152) (1,858) (6,740) (514) (7,254)
Transfers to MHFS/LHFS (1) (99) (9,778) (9,877) (258) (11) (269)
(1) The “Purchases” and “Transfers to MHFS/LHFS" categories exclude activity in government insured/guaranteed real estate 1-4 family first mortgage loans. As servicer, we
are able to buy delinquent insured/guaranteed loans out of the Government National Mortgage Association (GNMA) pools. These loans have different risk characteristics
from the rest of our consumer portfolio, whereby this activity does not impact the allowance for loan losses in the same manner because the loans are predominantly
insured by the Federal Housing Administration (FHA) or guaranteed by the Department of Veterans Affairs (VA). Such purchases net of transfers to MHFS were $2.9 billion
and $8.2 billion for the year ended 2014 and 2013, respectively.
161