Wells Fargo 2014 Annual Report Download - page 212
Download and view the complete annual report
Please find page 212 of the 2014 Wells Fargo annual report below. You can navigate through the pages in the report by either clicking on the pages listed below, or by using the keyword search tool below to find specific information within the annual report.-
 1
1 -
2
-
3
-
4
-
5
-
6
-
7
-
8
-
9
-
10
-
11
-
12
-
13
-
14
-
15
-
16
-
17
-
18
-
19
-
20
-
21
-
22
-
23
-
24
-
25
-
26
-
27
-
28
-
29
-
30
-
31
-
32
-
33
-
34
-
35
-
36
-
37
-
38
-
39
-
40
-
41
-
42
-
43
-
44
-
45
-
46
-
47
-
48
-
49
-
50
-
51
-
52
-
53
-
54
-
55
-
56
-
57
-
58
-
59
-
60
-
61
-
62
-
63
-
64
-
65
-
66
-
67
-
68
-
69
-
70
-
71
-
72
-
73
-
74
-
75
-
76
-
77
-
78
-
79
-
80
-
81
-
82
-
83
-
84
-
85
-
86
-
87
-
88
-
89
-
90
-
91
-
92
-
93
-
94
-
95
-
96
-
97
-
98
-
99
-
100
-
101
-
102
-
103
-
104
-
105
-
106
-
107
-
108
-
109
-
110
-
111
-
112
-
113
-
114
-
115
-
116
-
117
-
118
-
119
-
120
-
121
-
122
-
123
-
124
-
125
-
126
-
127
-
128
-
129
-
130
-
131
-
132
-
133
-
134
-
135
-
136
-
137
-
138
-
139
-
140
-
141
-
142
-
143
-
144
-
145
-
146
-
147
-
148
-
149
-
150
-
151
-
152
-
153
-
154
-
155
-
156
-
157
-
158
-
159
-
160
-
161
-
162
-
163
-
164
-
165
-
166
-
167
-
168
-
169
-
170
-
171
-
172
-
173
-
174
-
175
-
176
-
177
-
178
-
179
-
180
-
181
-
182
-
183
-
184
-
185
-
186
-
187
-
188
-
189
-
190
-
191
-
192
-
193
-
194
-
195
-
196
-
197
-
198
-
199
-
200
-
201
-
 202
202 -
 203
203 -
 204
204 -
 205
205 -
 206
206 -
 207
207 -
 208
208 -
 209
209 -
 210
210 -
 211
211 -
 212
212 -
 213
213 -
 214
214 -
 215
215 -
 216
216 -
 217
217 -
 218
218 -
 219
219 -
 220
220 -
 221
221 -
 222
222 -
223
-
224
-
225
-
226
-
227
-
228
-
229
-
230
-
231
-
232
-
233
-
234
-
235
-
236
-
237
-
238
-
239
-
240
-
241
-
242
-
243
-
244
-
245
-
246
-
247
-
248
-
249
-
250
-
251
-
252
-
253
-
254
-
255
-
256
-
257
-
258
-
259
-
260
-
261
-
262
-
263
-
264
-
265
-
266
-
267
-
268
 |
 |

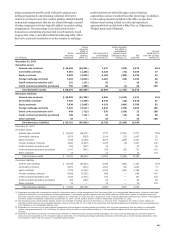
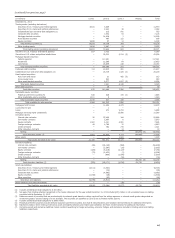
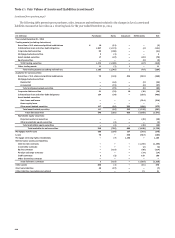
Note 16: Derivatives (continued)
The following table shows the net gains recognized in the
income statement related to derivatives not designated as
hedging instruments.
Year ended December 31,
(in millions) 2014 2013 2012
Net gains (losses) recognized on economic hedge derivatives:
Interest rate contracts
Recognized in noninterest income:
Mortgage banking (1) $ 1,759 1,412 (1,882)
Other (2) (230) 119 2
Equity contracts (3) (469) (317) 4
Foreign exchange contracts (2) 758 24 (53)
Credit contracts (2) (1) (6) (15)
Subtotal 1,817 1,232 (1,944)
Net gains (losses) recognized on customer accommodation, trading and other
derivatives:
Interest rate contracts
Recognized in noninterest income:
Mortgage banking (4) 1,350 (561) 7,222
Other (5) (855) 743 589
Commodity contracts (5) 77 324 (14)
Equity contracts (5) (719) (622) (234)
Foreign exchange contracts (5) 593 746 501
Credit contracts (5) 7 (53) (54)
Other (5) (39) — —
Subtotal 414 577 8,010
Net gains recognized related to derivatives not designated as hedging instruments $ 2,231 1,809 6,066
(1) Predominantly mortgage banking noninterest income including gains (losses) on the derivatives used as economic hedges of MSRs measured at fair value, interest rate lock
commitments and mortgages held for sale.
(2) Predominantly included in other noninterest income.
(3) Predominantly included in net gains (losses) from equity investments in noninterest income.
(4) Predominantly mortgage banking noninterest income including gains (losses) on interest rate lock commitments.
(5) Predominantly included in net gains from trading activities in noninterest income.
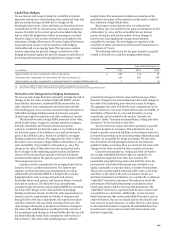
Credit Derivatives
Credit derivative contracts are arrangements whose value is
derived from the transfer of credit risk of a reference asset or
entity from one party (the purchaser of credit protection) to
another party (the seller of credit protection). We use credit
derivatives primarily to assist customers with their risk
management objectives. We may also use credit derivatives in
structured product transactions or liquidity agreements written
to special purpose vehicles. The maximum exposure of sold
credit derivatives is managed through posted collateral,
purchased credit derivatives and similar products in order to
achieve our desired credit risk profile. This credit risk
management provides an ability to recover a significant portion
of any amounts that would be paid under the sold credit
derivatives. We would be required to perform under the noted
credit derivatives in the event of default by the referenced
obligors. Events of default include events such as bankruptcy,
capital restructuring or lack of principal and/or interest
payment. In certain cases, other triggers may exist, such as the
credit downgrade of the referenced obligors or the inability of
the special purpose vehicle for which we have provided liquidity
to obtain funding.
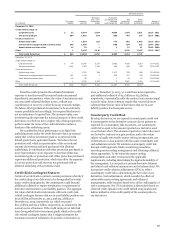
The following table provides details of sold and purchased
credit derivatives.
210