Wells Fargo 2014 Annual Report Download - page 185
Download and view the complete annual report
Please find page 185 of the 2014 Wells Fargo annual report below. You can navigate through the pages in the report by either clicking on the pages listed below, or by using the keyword search tool below to find specific information within the annual report.-
 1
1 -
2
-
3
-
4
-
5
-
6
-
7
-
8
-
9
-
10
-
11
-
12
-
13
-
14
-
15
-
16
-
17
-
18
-
19
-
20
-
21
-
22
-
23
-
24
-
25
-
26
-
27
-
28
-
29
-
30
-
31
-
32
-
33
-
34
-
35
-
36
-
37
-
38
-
39
-
40
-
41
-
42
-
43
-
44
-
45
-
46
-
47
-
48
-
49
-
50
-
51
-
52
-
53
-
54
-
55
-
56
-
57
-
58
-
59
-
60
-
61
-
62
-
63
-
64
-
65
-
66
-
67
-
68
-
69
-
70
-
71
-
72
-
73
-
74
-
75
-
76
-
77
-
78
-
79
-
80
-
81
-
82
-
83
-
84
-
85
-
86
-
87
-
88
-
89
-
90
-
91
-
92
-
93
-
94
-
95
-
96
-
97
-
98
-
99
-
100
-
101
-
102
-
103
-
104
-
105
-
106
-
107
-
108
-
109
-
110
-
111
-
112
-
113
-
114
-
115
-
116
-
117
-
118
-
119
-
120
-
121
-
122
-
123
-
124
-
125
-
126
-
127
-
128
-
129
-
130
-
131
-
132
-
133
-
134
-
135
-
136
-
137
-
138
-
139
-
140
-
141
-
142
-
143
-
144
-
145
-
146
-
147
-
148
-
149
-
150
-
151
-
152
-
153
-
154
-
155
-
156
-
157
-
158
-
159
-
160
-
161
-
162
-
163
-
164
-
165
-
166
-
167
-
168
-
169
-
170
-
171
-
172
-
173
-
174
-
 175
175 -
 176
176 -
 177
177 -
 178
178 -
 179
179 -
 180
180 -
 181
181 -
 182
182 -
 183
183 -
 184
184 -
 185
185 -
 186
186 -
 187
187 -
 188
188 -
 189
189 -
 190
190 -
 191
191 -
 192
192 -
 193
193 -
 194
194 -
 195
195 -
196
-
197
-
198
-
199
-
200
-
201
-
202
-
203
-
204
-
205
-
206
-
207
-
208
-
209
-
210
-
211
-
212
-
213
-
214
-
215
-
216
-
217
-
218
-
219
-
220
-
221
-
222
-
223
-
224
-
225
-
226
-
227
-
228
-
229
-
230
-
231
-
232
-
233
-
234
-
235
-
236
-
237
-
238
-
239
-
240
-
241
-
242
-
243
-
244
-
245
-
246
-
247
-
248
-
249
-
250
-
251
-
252
-
253
-
254
-
255
-
256
-
257
-
258
-
259
-
260
-
261
-
262
-
263
-
264
-
265
-
266
-
267
-
268
 |
 |

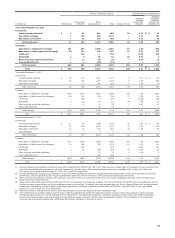
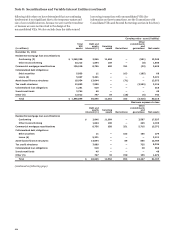
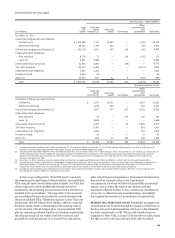
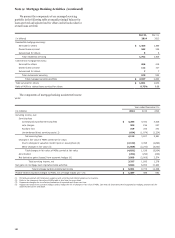
(continued from previous page)
Carrying value - asset (liability)
Other
Total Debt and commitments
(in millions) VIE
assets equity
interests (1) Servicing
assets Derivatives and
guarantees Net assets
December 31, 2013
Residential mortgage loan securitizations:
Conforming (2) $ 1,314,285 2,721 14,253 — (745) 16,229
Other/nonconforming 38,330 1,739 258 — (26) 1,971
Commercial mortgage securitizations (3) 202,700 7,627 747 209 (40) 8,543
Collateralized debt obligations:
Debt securities 6,730 37 — 214 (130) 121
Loans (4) 6,021 5,888 — — — 5,888
Asset-based finance structures 11,415 6,857 — (84) — 6,773
Tax credit structures 23,112 6,455 — — (2,213) 4,242
Collateralized loan obligations 4,382 1,061 — — — 1,061
Investment funds 3,464 54 — — — 54
Other (5) 10,343 860 23 5 (189) 699
Total $ 1,620,782 33,299 15,281 344 (3,343) 45,581
Maximum exposure to loss
Other
Debt and commitments
equity
interests (1) Servicing
assets Derivatives and
guarantees Net assets
Residential mortgage loan securitizations:
Conforming $ 2,721 14,253 — 2,287 19,261
Other/nonconforming 1,739 258 — 346 2,343
Commercial mortgage securitizations (3) 7,627 747 322 5,232 13,928
Collateralized debt obligations:
Debt securities 37 — 214 130 381
Loans (4) 5,888 — — — 5,888
Asset-based finance structures 6,857 — 84 1,665 8,606
Tax credit structures 6,455 — — 626 7,081
Collateralized loan obligations 1,061 — — 159 1,220
Investment funds 54 — — 31 85
Other (5) 860 23 178 188 1,249
Total $ 33,299 15,281 798 10,664 60,042
(1) Includes total equity interests of $8.1 billion at December 31, 2014 and $6.9 billion at December 31, 2013. Also includes debt interests in the form of both loans and
securities. Excludes certain debt securities held related to loans serviced for FNMA, FHLMC and GNMA.
(2) Excludes assets and related liabilities with a recorded carrying value on our balance sheet of $1.7 billion and $2.1 billion at December 31, 2014 and 2013, respectively, for
certain delinquent loans that are eligible for repurchase primarily from GNMA loan securitizations. The recorded carrying value represents the amount that would be
payable if the Company was to exercise the repurchase option. The carrying amounts are excluded from the table because the loans eligible for repurchase do not
represent interests in the VIEs.
(3) December 31, 2013, has been revised to include certain commercial mortgage securitizations with FNMA and GNMA to conform with current period presentation.
(4) Represents senior loans to trusts that are collateralized by asset-backed securities. The trusts invest primarily in senior tranches from a diversified pool of primarily U.S.
asset securitizations, of which all are current and 70% and 72% were rated as investment grade by the primary rating agencies at December 31, 2014 and 2013,
respectively. These senior loans are accounted for at amortized cost and are subject to the Company’s allowance and credit charge-off policies.
(5) Includes structured financing and credit-linked note structures. Also contains investments in auction rate securities (ARS) issued by VIEs that we do not sponsor and,
accordingly, are unable to obtain the total assets of the entity.
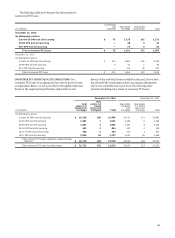
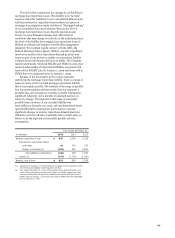
In the two preceding tables, “Total VIE assets” represents other commitments and guarantees. It represents estimated loss
the remaining principal balance of assets held by unconsolidated that would be incurred under severe, hypothetical
VIEs using the most current information available. For VIEs that circumstances, for which we believe the possibility is extremely
obtain exposure to assets synthetically through derivative remote, such as where the value of our interests and any
instruments, the remaining notional amount of the derivative is associated collateral declines to zero, without any consideration
included in the asset balance. “Carrying value” is the amount in of recovery or offset from any economic hedges. Accordingly,
our consolidated balance sheet related to our involvement with this required disclosure is not an indication of expected loss.
the unconsolidated VIEs. “Maximum exposure to loss” from our
involvement with off-balance sheet entities, which is a required RESIDENTIAL MORTGAGE LOANS Residential mortgage loan
disclosure under GAAP, is determined as the carrying value of securitizations are financed through the issuance of fixed-rate or
our involvement with off-balance sheet (unconsolidated) VIEs floating-rate asset-backed securities, which are collateralized by
plus the remaining undrawn liquidity and lending commitments, the loans transferred to a VIE. We typically transfer loans we
the notional amount of net written derivative contracts, and originated to these VIEs, account for the transfers as sales, retain
generally the notional amount of, or stressed loss estimate for, the right to service the loans and may hold other beneficial
183