Wells Fargo 2014 Annual Report Download - page 165
Download and view the complete annual report
Please find page 165 of the 2014 Wells Fargo annual report below. You can navigate through the pages in the report by either clicking on the pages listed below, or by using the keyword search tool below to find specific information within the annual report.-
 1
1 -
2
-
3
-
4
-
5
-
6
-
7
-
8
-
9
-
10
-
11
-
12
-
13
-
14
-
15
-
16
-
17
-
18
-
19
-
20
-
21
-
22
-
23
-
24
-
25
-
26
-
27
-
28
-
29
-
30
-
31
-
32
-
33
-
34
-
35
-
36
-
37
-
38
-
39
-
40
-
41
-
42
-
43
-
44
-
45
-
46
-
47
-
48
-
49
-
50
-
51
-
52
-
53
-
54
-
55
-
56
-
57
-
58
-
59
-
60
-
61
-
62
-
63
-
64
-
65
-
66
-
67
-
68
-
69
-
70
-
71
-
72
-
73
-
74
-
75
-
76
-
77
-
78
-
79
-
80
-
81
-
82
-
83
-
84
-
85
-
86
-
87
-
88
-
89
-
90
-
91
-
92
-
93
-
94
-
95
-
96
-
97
-
98
-
99
-
100
-
101
-
102
-
103
-
104
-
105
-
106
-
107
-
108
-
109
-
110
-
111
-
112
-
113
-
114
-
115
-
116
-
117
-
118
-
119
-
120
-
121
-
122
-
123
-
124
-
125
-
126
-
127
-
128
-
129
-
130
-
131
-
132
-
133
-
134
-
135
-
136
-
137
-
138
-
139
-
140
-
141
-
142
-
143
-
144
-
145
-
146
-
147
-
148
-
149
-
150
-
151
-
152
-
153
-
154
-
 155
155 -
 156
156 -
 157
157 -
 158
158 -
 159
159 -
 160
160 -
 161
161 -
 162
162 -
 163
163 -
 164
164 -
 165
165 -
 166
166 -
 167
167 -
 168
168 -
 169
169 -
 170
170 -
 171
171 -
 172
172 -
 173
173 -
 174
174 -
 175
175 -
176
-
177
-
178
-
179
-
180
-
181
-
182
-
183
-
184
-
185
-
186
-
187
-
188
-
189
-
190
-
191
-
192
-
193
-
194
-
195
-
196
-
197
-
198
-
199
-
200
-
201
-
202
-
203
-
204
-
205
-
206
-
207
-
208
-
209
-
210
-
211
-
212
-
213
-
214
-
215
-
216
-
217
-
218
-
219
-
220
-
221
-
222
-
223
-
224
-
225
-
226
-
227
-
228
-
229
-
230
-
231
-
232
-
233
-
234
-
235
-
236
-
237
-
238
-
239
-
240
-
241
-
242
-
243
-
244
-
245
-
246
-
247
-
248
-
249
-
250
-
251
-
252
-
253
-
254
-
255
-
256
-
257
-
258
-
259
-
260
-
261
-
262
-
263
-
264
-
265
-
266
-
267
-
268
 |
 |

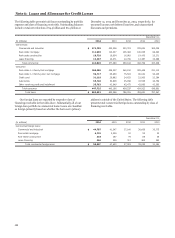
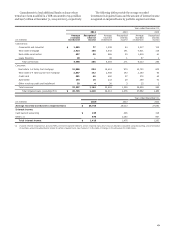
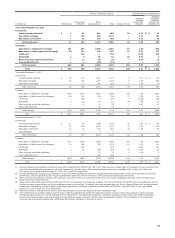
Allowance for Credit Losses
The allowance for credit losses consists of the allowance for loan
losses and the allowance for unfunded credit commitments.
Changes in the allowance for credit losses were:
Year ended December 31,
(in millions) 2014 2013 2012 2011 2010
Balance, beginning of year $ 14,971 17,477 19,668 23,463 25,031
Provision for credit losses 1,395 2,309 7,217 7,899 15,753
Interest income on certain impaired loans (1) (211) (264) (315) (332) (266)
Loan charge-offs:
Commercial:
Commercial and industrial (627) (739) (1,404) (1,681) (2,820)
Real estate mortgage (66) (190) (382) (636) (1,152)
Real estate construction (9) (28) (191) (351) (1,189)
Lease financing (15) (34) (24) (41) (124)
Total commercial (717) (991) (2,001) (2,709) (5,285)
Consumer:
Real estate 1-4 family first mortgage (721) (1,439) (3,020) (3,896) (4,916)
Real estate 1-4 family junior lien mortgage (864) (1,579) (3,437) (3,765) (4,936)
Credit card (1,025) (1,022) (1,105) (1,458) (2,415)
Automobile (729) (625) (651) (797) (1,295)
Other revolving credit and installment (668) (754) (759) (990) (1,253)
Total consumer (4,007) (5,419) (8,972) (10,906) (14,815)
Total loan charge-offs (4,724) (6,410) (10,973) (13,615) (20,100)
Loan recoveries:
Commercial:
Commercial and industrial 369 396 472 426 442
Real estate mortgage 160 226 163 143 68
Real estate construction 136 137 124 146 110
Lease financing 8 17 20 25 21
Total commercial 673 776 779 740 641
Consumer:
Real estate 1-4 family first mortgage 212 246 157 405 523
Real estate 1-4 family junior lien mortgage 238 269 260 218 211
Credit card 161 127 188 257 224
Automobile 349 322 364 449 509
Other revolving credit and installment 146 161 191 247 239
Total consumer 1,106 1,125 1,160 1,576 1,706
Total loan recoveries 1,779 1,901 1,939 2,316 2,347
Net loan charge-offs (2) (2,945) (4,509) (9,034) (11,299) (17,753)
Allowances related to business combinations/other (3) (41) (42) (59) (63) 698
Balance, end of year $ 13,169 14,971 17,477 19,668 23,463
Components:
Allowance for loan losses $ 12,319 14,502 17,060 19,372 23,022
Allowance for unfunded credit commitments 850 469 417 296 441
Allowance for credit losses (4) $ 13,169 14,971 17,477 19,668 23,463
Net loan charge-offs as a percentage of average total loans (2) 0.35% 0.56 1.17 1.49 2.30
Allowance for loan losses as a percentage of total loans (4) 1.43 1.76 2.13 2.52 3.04
Allowance for credit losses as a percentage of total loans (4) 1.53 1.82 2.19 2.56 3.10
(1) Certain impaired loans with an allowance calculated by discounting expected cash flows using the loan’s effective interest rate over the remaining life of the loan recognize
reductions in the allowance as interest income.
(2) For PCI loans, charge-offs are only recorded to the extent that losses exceed the purchase accounting estimates.
(3) Includes $693 million for the year ended December 31, 2010, related to the adoption of consolidation accounting guidance on January 1, 2010.
(4) The allowance for credit losses includes $11 million, $30 million, $117 million, $231 million and $298 million at December 31, 2014, 2013, 2012, 2011, and 2010,
respectively, related to PCI loans acquired from Wachovia. Loans acquired from Wachovia are included in total loans net of related purchase accounting net write-downs.
163