Wells Fargo 2014 Annual Report Download - page 46
Download and view the complete annual report
Please find page 46 of the 2014 Wells Fargo annual report below. You can navigate through the pages in the report by either clicking on the pages listed below, or by using the keyword search tool below to find specific information within the annual report.-
 1
1 -
2
-
3
-
4
-
5
-
6
-
7
-
8
-
9
-
10
-
11
-
12
-
13
-
14
-
15
-
16
-
17
-
18
-
19
-
20
-
21
-
22
-
23
-
24
-
25
-
26
-
27
-
28
-
29
-
30
-
31
-
32
-
33
-
34
-
35
-
 36
36 -
 37
37 -
 38
38 -
 39
39 -
 40
40 -
 41
41 -
 42
42 -
 43
43 -
 44
44 -
 45
45 -
 46
46 -
 47
47 -
 48
48 -
 49
49 -
 50
50 -
 51
51 -
 52
52 -
 53
53 -
 54
54 -
 55
55 -
 56
56 -
57
-
58
-
59
-
60
-
61
-
62
-
63
-
64
-
65
-
66
-
67
-
68
-
69
-
70
-
71
-
72
-
73
-
74
-
75
-
76
-
77
-
78
-
79
-
80
-
81
-
82
-
83
-
84
-
85
-
86
-
87
-
88
-
89
-
90
-
91
-
92
-
93
-
94
-
95
-
96
-
97
-
98
-
99
-
100
-
101
-
102
-
103
-
104
-
105
-
106
-
107
-
108
-
109
-
110
-
111
-
112
-
113
-
114
-
115
-
116
-
117
-
118
-
119
-
120
-
121
-
122
-
123
-
124
-
125
-
126
-
127
-
128
-
129
-
130
-
131
-
132
-
133
-
134
-
135
-
136
-
137
-
138
-
139
-
140
-
141
-
142
-
143
-
144
-
145
-
146
-
147
-
148
-
149
-
150
-
151
-
152
-
153
-
154
-
155
-
156
-
157
-
158
-
159
-
160
-
161
-
162
-
163
-
164
-
165
-
166
-
167
-
168
-
169
-
170
-
171
-
172
-
173
-
174
-
175
-
176
-
177
-
178
-
179
-
180
-
181
-
182
-
183
-
184
-
185
-
186
-
187
-
188
-
189
-
190
-
191
-
192
-
193
-
194
-
195
-
196
-
197
-
198
-
199
-
200
-
201
-
202
-
203
-
204
-
205
-
206
-
207
-
208
-
209
-
210
-
211
-
212
-
213
-
214
-
215
-
216
-
217
-
218
-
219
-
220
-
221
-
222
-
223
-
224
-
225
-
226
-
227
-
228
-
229
-
230
-
231
-
232
-
233
-
234
-
235
-
236
-
237
-
238
-
239
-
240
-
241
-
242
-
243
-
244
-
245
-
246
-
247
-
248
-
249
-
250
-
251
-
252
-
253
-
254
-
255
-
256
-
257
-
258
-
259
-
260
-
261
-
262
-
263
-
264
-
265
-
266
-
267
-
268
 |
 |

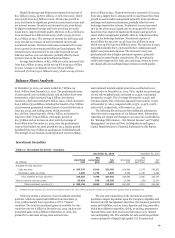
Earnings Performance (continued)
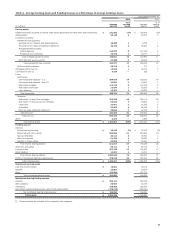
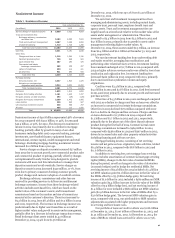
Operating Segments
We are organized for management reporting purposes into three
operating segments: Community Banking; Wholesale Banking;
and Wealth, Brokerage and Retirement (WBR). These segments
are defined by product type and customer segment and their
results are based on our management accounting process, for
which there is no comprehensive, authoritative financial
accounting guidance equivalent to generally accepted accounting
principles (GAAP). In addition to measuring financial
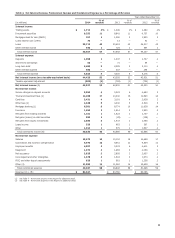
Table 9: Operating Segment Results – Highlights
performance, each of our operating segments monitors cross-sell
metrics to measure the extent they are satisfying our customers’
financial needs. The following discussion presents our
methodology for measuring cross-sell for each of our operating
segments, and along with Tables 9, 9a, 9b and 9c, presents our
results by operating segment. For additional financial
information and the underlying management accounting
process, see Note 24 (Operating Segments) to Financial
Statements in this Report.
Year ended December 31,
Wealth,
(in millions, except average balances which are in billions) Community
Banking Wholesale
Banking
Brokerage
and
Retirement Other (1) Consolidated
Company
2014
Revenue $ 50,862 23,482 14,218 (4,215) 84,347
Provision (reversal of provision) for credit losses 1,681 (266) (50) 30 1,395
Net income (loss) 14,180 7,584 2,083 (790) 23,057
Average loans $ 503.2 313.4 52.1 (34.3) 834.4
Average core deposits 642.3 274.0 154.9 (67.6) 1,003.6
2013
Revenue $ 50,339 24,064 13,203 (3,826) 83,780
Provision (reversal of provision) for credit losses 2,755 (445) (16) 15 2,309
Net income (loss) 12,732 8,133 1,712 (699) 21,878
Average loans $ 499.3 287.7 46.1 (30.4) 802.7
Average core deposits 620.1 237.2 150.1 (65.3) 942.1
2012
Revenue $ 53,405 24,092 12,160 (3,571) 86,086
Provision (reversal of provision) for credit losses 6,835 286 125 (29) 7,217
Net income (loss) 10,492 7,774 1,328 (697) 18,897
Average loans $ 487.1 273.8 42.7 (28.4) 775.2
Average core deposits 591.2 227.0 137.5 (61.8) 893.9
(1) Includes items not assigned to a specific business segment and elimination of certain items that are included in more than one business segment, substantially all of which
represents products and services for wealth management customers provided in Community Banking stores.
Cross-sell Our cross-sell strategy is to increase the number of
products our customers use by offering them all of the financial
products that satisfy their financial needs. We track our cross-
sell activities based on whether the customer is a retail banking
household or has a wholesale banking relationship. A retail
banking household is a household that uses at least one of the
following retail products - a demand deposit account, savings
account, savings certificate, individual retirement account (IRA)
certificate of deposit, IRA savings account, personal line of
credit, personal loan, home equity line of credit or home equity
loan. A household is determined based on aggregating all
accounts with the same address. For our wholesale banking
relationships, we aggregate all related entities under common
ownership or control.
We report cross-sell metrics for our Community Banking
and WBR operating segments based on the average number of
retail products used per retail banking household. For
Community Banking the cross-sell metric represents the
relationship of all retail products used by customers in retail
banking households. For WBR the cross-sell metric represents
the relationship of all retail products used by customers in retail
banking households who are also WBR customers.
Products included in our retail banking household cross-sell
metrics must be retail products and have the potential for
revenue generation and long-term viability. Products and
services that generally do not meet these criteria - such as ATM
cards, online banking and direct deposit - are not included. In
addition, multiple holdings by a brokerage customer within an
investment category, such as common stock, mutual funds or
bonds, are counted as a single product. We may periodically
update the products included in our cross-sell metrics to
account for changes in our product offerings.
For our Wholesale Banking operating segment cross-sell
represents the average number of Wholesale Banking (non-
retail) products used per Wholesale Banking customer
relationship. What we include as products in the cross-sell
metric comes from a defined set of revenue generating products
within the following product families: credit, treasury
management, deposits, risk management, foreign exchange,
capital markets and advisory, investments, insurance, trade
financing, and trust and servicing. The number of customer
relationships is based on tax identification numbers adjusted to
combine those entities under common ownership or another
structure indicative of a single relationship and includes only
relationships that produced revenue for the period of
measurement.
44