Wells Fargo 2014 Annual Report Download - page 72
Download and view the complete annual report
Please find page 72 of the 2014 Wells Fargo annual report below. You can navigate through the pages in the report by either clicking on the pages listed below, or by using the keyword search tool below to find specific information within the annual report.-
 1
1 -
2
-
3
-
4
-
5
-
6
-
7
-
8
-
9
-
10
-
11
-
12
-
13
-
14
-
15
-
16
-
17
-
18
-
19
-
20
-
21
-
22
-
23
-
24
-
25
-
26
-
27
-
28
-
29
-
30
-
31
-
32
-
33
-
34
-
35
-
36
-
37
-
38
-
39
-
40
-
41
-
42
-
43
-
44
-
45
-
46
-
47
-
48
-
49
-
50
-
51
-
52
-
53
-
54
-
55
-
56
-
57
-
58
-
59
-
60
-
61
-
 62
62 -
 63
63 -
 64
64 -
 65
65 -
 66
66 -
 67
67 -
 68
68 -
 69
69 -
 70
70 -
 71
71 -
 72
72 -
 73
73 -
 74
74 -
 75
75 -
 76
76 -
 77
77 -
 78
78 -
 79
79 -
 80
80 -
 81
81 -
 82
82 -
83
-
84
-
85
-
86
-
87
-
88
-
89
-
90
-
91
-
92
-
93
-
94
-
95
-
96
-
97
-
98
-
99
-
100
-
101
-
102
-
103
-
104
-
105
-
106
-
107
-
108
-
109
-
110
-
111
-
112
-
113
-
114
-
115
-
116
-
117
-
118
-
119
-
120
-
121
-
122
-
123
-
124
-
125
-
126
-
127
-
128
-
129
-
130
-
131
-
132
-
133
-
134
-
135
-
136
-
137
-
138
-
139
-
140
-
141
-
142
-
143
-
144
-
145
-
146
-
147
-
148
-
149
-
150
-
151
-
152
-
153
-
154
-
155
-
156
-
157
-
158
-
159
-
160
-
161
-
162
-
163
-
164
-
165
-
166
-
167
-
168
-
169
-
170
-
171
-
172
-
173
-
174
-
175
-
176
-
177
-
178
-
179
-
180
-
181
-
182
-
183
-
184
-
185
-
186
-
187
-
188
-
189
-
190
-
191
-
192
-
193
-
194
-
195
-
196
-
197
-
198
-
199
-
200
-
201
-
202
-
203
-
204
-
205
-
206
-
207
-
208
-
209
-
210
-
211
-
212
-
213
-
214
-
215
-
216
-
217
-
218
-
219
-
220
-
221
-
222
-
223
-
224
-
225
-
226
-
227
-
228
-
229
-
230
-
231
-
232
-
233
-
234
-
235
-
236
-
237
-
238
-
239
-
240
-
241
-
242
-
243
-
244
-
245
-
246
-
247
-
248
-
249
-
250
-
251
-
252
-
253
-
254
-
255
-
256
-
257
-
258
-
259
-
260
-
261
-
262
-
263
-
264
-
265
-
266
-
267
-
268
 |
 |

Risk Management - Credit Risk Management (continued)
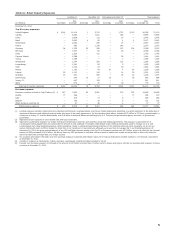
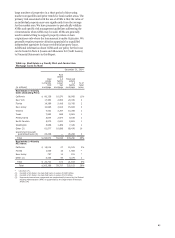
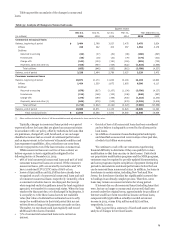
Table 27: Pick-a-Pay Portfolio (1)
December 31, 2014
PCI loans All other loans
Ratio of Ratio of
Adjusted carrying carrying
unpaid Current value to value to
principal LTV Carrying current Carrying current
(in millions) balance (2) ratio (3) value (4) value (5) value (4) value (5)
California $ 18,257 77% $ 15,001 62% $ 11,426 57%
Florida 2,108 87 1,523 59 2,375 71
New Jersey 890 83 768 65 1,527 70
New York 564 77 522 64 714 67
Texas 233 62 206 54 920 50
Other states 4,252 82 3,493 65 6,527 69
Total Pick-a-Pay loans $ 26,304 $ 21,513 $ 23,489
(1) The individual states shown in this table represent the top five states based on the total net carrying value of the Pick-a-Pay loans at the beginning of 2014.
(2) Adjusted unpaid principal balance includes write-downs taken on loans where severe delinquency (normally 180 days) or other indications of severe borrower financial
stress exist that indicate there will be a loss of contractually due amounts upon final resolution of the loan.
(3) The current LTV ratio is calculated as the adjusted unpaid principal balance divided by the collateral value. Collateral values are generally determined using automated
valuation models (AVM) and are updated quarterly. AVMs are computer-based tools used to estimate market values of homes based on processing large volumes of market
data including market comparables and price trends for local market areas.
(4) Carrying value, which does not reflect the allowance for loan losses, includes remaining purchase accounting adjustments, which, for PCI loans may include the
nonaccretable difference and the accretable yield and, for all other loans, an adjustment to mark the loans to a market yield at date of merger less any subsequent charge-
offs.
(5) The ratio of carrying value to current value is calculated as the carrying value divided by the collateral value.
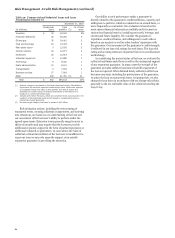
To maximize return and allow flexibility for customers to
avoid foreclosure, we have in place several loss mitigation
strategies for our Pick-a-Pay loan portfolio. We contact
customers who are experiencing financial difficulty and may in
certain cases modify the terms of a loan based on a customer’s
documented income and other circumstances.
We also have taken steps to work with customers to refinance
or restructure their Pick-a-Pay loans into other loan products.
For customers at risk, we offer combinations of term extensions
of up to 40 years (from 30 years), interest rate reductions,
forbearance of principal, and, in certain cases we may offer
principal forgiveness to customers with substantial property
value declines based on affordability needs.
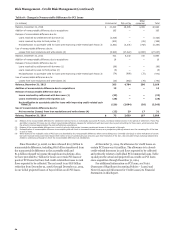
In 2014, we completed more than 5,300 proprietary and
Home Affordability Modification Program (HAMP) Pick-a-Pay
loan modifications. We have completed nearly 130,000
modifications since the Wachovia acquisition, resulting in $6.0
billion of principal forgiveness to our Pick-a-Pay customers.
There remains $30 million of conditional forgiveness that can be
earned by borrowers through performance over a three year
period.
Due to better than expected performance observed on the
Pick-a-Pay PCI portfolio compared with the original acquisition
estimates, we have reclassified $6.0 billion from the
nonaccretable difference to the accretable yield since acquisition.
Our cash flows expected to be collected have been favorably
affected by lower expected defaults and losses as a result of
observed and forecasted economic strengthening, particularly in
housing prices, and our loan modification efforts. These factors
are expected to reduce the frequency and severity of defaults and
keep these loans performing for a longer period, thus increasing
future principal and interest cash flows. The resulting increase in
the accretable yield will be realized over the remaining life of the
portfolio, which is estimated to have a weighted-average
remaining life of approximately 11.7 years at December 31, 2014,
down from 12.7 years at December 31, 2013, primarily reflecting
the passage of time. The accretable yield percentage at
December 31, 2014 was 6.15%, up from 4.98% at the end of 2013
due to favorable changes in the expected timing and composition
of cash flows resulting from improving credit and prepayment
expectations. Fluctuations in the accretable yield are driven by
changes in interest rate indices for variable rate PCI loans,
prepayment assumptions, and expected principal and interest
payments over the estimated life of the portfolio, which will be
affected by the pace and degree of improvements in the U.S.
economy and housing markets and projected lifetime
performance resulting from loan modification activity. Changes
in the projected timing of cash flow events, including loan
liquidations, modifications and short sales, can also affect the
accretable yield rate and the estimated weighted-average life of
the portfolio.
The predominant portion of our PCI loans is included in the
Pick-a-Pay portfolio. For further information on the judgment
involved in estimating expected cash flows for PCI loans, see the
“Critical Accounting Policies – Purchased Credit-Impaired
Loans” section and Note 1 (Summary of Significant Accounting
Policies) to Financial Statements in this Report.
Junior Lien Mortgage Portfolio The junior lien mortgage
portfolio consists of residential mortgage lines and loans that are
subordinate in rights to an existing lien on the same property. It
is not unusual for these lines and loans to have draw periods,
interest only payments, balloon payments, adjustable rates and
similar features. The majority of our junior lien loan products
are amortizing payment loans with fixed interest rates and
repayment periods between five to 30 years.
We continuously monitor the credit performance of our
junior lien mortgage portfolio for trends and factors that
influence the frequency and severity of loss. We have observed
that the severity of loss for junior lien mortgages is high and
generally not affected by whether we or a third party own or
service the related first mortgage, but the frequency of
delinquency is typically lower when we own or service the first
lien mortgage. In general, we have limited information available
on the delinquency status of the third party owned or serviced
senior lien where we also hold a junior lien. To capture this
inherent loss content, we use the experience of our junior lien
mortgages behind delinquent first liens that are owned or
70