Wells Fargo 2014 Annual Report Download - page 195
Download and view the complete annual report
Please find page 195 of the 2014 Wells Fargo annual report below. You can navigate through the pages in the report by either clicking on the pages listed below, or by using the keyword search tool below to find specific information within the annual report.-
 1
1 -
 2
2 -
 3
3 -
 4
4 -
 5
5 -
 6
6 -
 7
7 -
 8
8 -
 9
9 -
 10
10 -
 11
11 -
 12
12 -
 13
13 -
 14
14 -
 15
15 -
 16
16 -
 17
17 -
 18
18 -
 19
19 -
 20
20 -
 21
21 -
 22
22 -
 23
23 -
 24
24 -
 25
25 -
 26
26 -
 27
27 -
 28
28 -
 29
29 -
 30
30 -
 31
31 -
 32
32 -
 33
33 -
 34
34 -
 35
35 -
 36
36 -
 37
37 -
 38
38 -
 39
39 -
 40
40 -
 41
41 -
 42
42 -
 43
43 -
 44
44 -
 45
45 -
 46
46 -
 47
47 -
 48
48 -
 49
49 -
 50
50 -
 51
51 -
 52
52 -
 53
53 -
 54
54 -
 55
55 -
 56
56 -
 57
57 -
 58
58 -
 59
59 -
 60
60 -
 61
61 -
 62
62 -
 63
63 -
 64
64 -
 65
65 -
 66
66 -
 67
67 -
 68
68 -
 69
69 -
 70
70 -
 71
71 -
 72
72 -
 73
73 -
 74
74 -
 75
75 -
 76
76 -
 77
77 -
 78
78 -
 79
79 -
 80
80 -
 81
81 -
 82
82 -
 83
83 -
 84
84 -
 85
85 -
 86
86 -
 87
87 -
 88
88 -
 89
89 -
 90
90 -
 91
91 -
 92
92 -
 93
93 -
 94
94 -
 95
95 -
 96
96 -
 97
97 -
 98
98 -
 99
99 -
 100
100 -
 101
101 -
 102
102 -
 103
103 -
 104
104 -
 105
105 -
 106
106 -
 107
107 -
 108
108 -
 109
109 -
 110
110 -
 111
111 -
 112
112 -
 113
113 -
 114
114 -
 115
115 -
 116
116 -
 117
117 -
 118
118 -
 119
119 -
 120
120 -
 121
121 -
 122
122 -
 123
123 -
 124
124 -
 125
125 -
 126
126 -
 127
127 -
 128
128 -
 129
129 -
 130
130 -
 131
131 -
 132
132 -
 133
133 -
 134
134 -
 135
135 -
 136
136 -
 137
137 -
 138
138 -
 139
139 -
 140
140 -
 141
141 -
 142
142 -
 143
143 -
 144
144 -
 145
145 -
 146
146 -
 147
147 -
 148
148 -
 149
149 -
 150
150 -
 151
151 -
 152
152 -
 153
153 -
 154
154 -
 155
155 -
 156
156 -
 157
157 -
 158
158 -
 159
159 -
 160
160 -
 161
161 -
 162
162 -
 163
163 -
 164
164 -
 165
165 -
 166
166 -
 167
167 -
 168
168 -
 169
169 -
 170
170 -
 171
171 -
 172
172 -
 173
173 -
 174
174 -
 175
175 -
 176
176 -
 177
177 -
 178
178 -
 179
179 -
 180
180 -
 181
181 -
 182
182 -
 183
183 -
 184
184 -
 185
185 -
 186
186 -
 187
187 -
 188
188 -
 189
189 -
 190
190 -
 191
191 -
 192
192 -
 193
193 -
 194
194 -
 195
195 -
 196
196 -
 197
197 -
 198
198 -
 199
199 -
 200
200 -
 201
201 -
 202
202 -
 203
203 -
 204
204 -
 205
205 -
 206
206 -
 207
207 -
 208
208 -
 209
209 -
 210
210 -
 211
211 -
 212
212 -
 213
213 -
 214
214 -
 215
215 -
 216
216 -
 217
217 -
 218
218 -
 219
219 -
 220
220 -
 221
221 -
 222
222 -
 223
223 -
 224
224 -
 225
225 -
 226
226 -
 227
227 -
 228
228 -
 229
229 -
 230
230 -
 231
231 -
 232
232 -
 233
233 -
 234
234 -
 235
235 -
 236
236 -
 237
237 -
 238
238 -
 239
239 -
 240
240 -
 241
241 -
 242
242 -
 243
243 -
 244
244 -
 245
245 -
 246
246 -
 247
247 -
 248
248 -
 249
249 -
 250
250 -
 251
251 -
 252
252 -
 253
253 -
 254
254 -
 255
255 -
 256
256 -
 257
257 -
 258
258 -
 259
259 -
 260
260 -
 261
261 -
 262
262 -
 263
263 -
 264
264 -
 265
265 -
 266
266 -
 267
267 -
 268
268
 |
 |

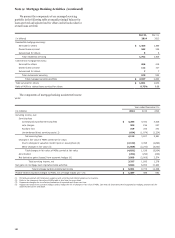
The table below summarizes the changes in our liability for
mortgage loan repurchase losses. This liability is in “Accrued
expenses and other liabilities” in our consolidated balance sheet
and the provision for repurchase losses reduces net gains on
mortgage loan origination/sales activities in "Mortgage banking"
in our consolidated income statement. Because the level of
mortgage loan repurchase losses depends upon economic
factors, investor demand strategies and other external
conditions that may change over the life of the underlying loans,
the level of the liability for mortgage loan repurchase losses is
difficult to estimate and requires considerable management
judgment. We maintain regular contact with the GSEs, the
Federal Housing Finance Agency (FHFA), and other significant
investors to monitor their repurchase demand practices and
issues as part of our process to update our repurchase liability
estimate as new information becomes available. The Company
reached settlements with both FHLMC and FNMA in 2013, that
resolved substantially all repurchase liabilities associated with
loans sold to FHLMC prior to January 1, 2009 and loans sold to
FNMA that were originated prior to January 1, 2009.
Because of the uncertainty in the various estimates
underlying the mortgage repurchase liability, there is a range of
losses in excess of the recorded mortgage repurchase liability
that is reasonably possible. The estimate of the range of possible
loss for representations and warranties does not represent a
probable loss, and is based on currently available information,
significant judgment, and a number of assumptions that are
subject to change. The high end of this range of reasonably
possible losses in excess of our recorded liability was
$973 million at December 31, 2014, and was determined based
upon modifying the assumptions (particularly to assume
significant changes in investor repurchase demand practices)
utilized in our best estimate of probable loss to reflect what we
believe to be the high end of reasonably possible adverse
assumptions.
Year ended December 31,
(in millions) 2014 2013 2012
Balance, beginning of year $ 899 2,206 1,326
Provision for repurchase losses:
Loan sales 44 143 275
Change in estimate (1) (184) 285 1,665
Total additions (reductions) (140) 428 1,940
Losses (2) (144) (1,735) (1,060)
Balance, end of year $ 615 899 2,206
(1) Results from changes in investor demand, mortgage insurer practices, credit
and the financial stability of correspondent lenders.
(2) Year ended December 31, 2013, reflects $746 million and $508 million as a
result of the settlements reached with FHLMC and FNMA, respectively, that
resolved substantially all repurchase liabilities associated with loans sold to
FHLMC prior to January 1, 2009 and loans sold to FNMA that were originated
prior to January 1, 2009.
193
