Wells Fargo 2014 Annual Report Download - page 188
Download and view the complete annual report
Please find page 188 of the 2014 Wells Fargo annual report below. You can navigate through the pages in the report by either clicking on the pages listed below, or by using the keyword search tool below to find specific information within the annual report.-
 1
1 -
2
-
3
-
4
-
5
-
6
-
7
-
8
-
9
-
10
-
11
-
12
-
13
-
14
-
15
-
16
-
17
-
18
-
19
-
20
-
21
-
22
-
23
-
24
-
25
-
26
-
27
-
28
-
29
-
30
-
31
-
32
-
33
-
34
-
35
-
36
-
37
-
38
-
39
-
40
-
41
-
42
-
43
-
44
-
45
-
46
-
47
-
48
-
49
-
50
-
51
-
52
-
53
-
54
-
55
-
56
-
57
-
58
-
59
-
60
-
61
-
62
-
63
-
64
-
65
-
66
-
67
-
68
-
69
-
70
-
71
-
72
-
73
-
74
-
75
-
76
-
77
-
78
-
79
-
80
-
81
-
82
-
83
-
84
-
85
-
86
-
87
-
88
-
89
-
90
-
91
-
92
-
93
-
94
-
95
-
96
-
97
-
98
-
99
-
100
-
101
-
102
-
103
-
104
-
105
-
106
-
107
-
108
-
109
-
110
-
111
-
112
-
113
-
114
-
115
-
116
-
117
-
118
-
119
-
120
-
121
-
122
-
123
-
124
-
125
-
126
-
127
-
128
-
129
-
130
-
131
-
132
-
133
-
134
-
135
-
136
-
137
-
138
-
139
-
140
-
141
-
142
-
143
-
144
-
145
-
146
-
147
-
148
-
149
-
150
-
151
-
152
-
153
-
154
-
155
-
156
-
157
-
158
-
159
-
160
-
161
-
162
-
163
-
164
-
165
-
166
-
167
-
168
-
169
-
170
-
171
-
172
-
173
-
174
-
175
-
176
-
177
-
 178
178 -
 179
179 -
 180
180 -
 181
181 -
 182
182 -
 183
183 -
 184
184 -
 185
185 -
 186
186 -
 187
187 -
 188
188 -
 189
189 -
 190
190 -
 191
191 -
 192
192 -
 193
193 -
 194
194 -
 195
195 -
 196
196 -
 197
197 -
 198
198 -
199
-
200
-
201
-
202
-
203
-
204
-
205
-
206
-
207
-
208
-
209
-
210
-
211
-
212
-
213
-
214
-
215
-
216
-
217
-
218
-
219
-
220
-
221
-
222
-
223
-
224
-
225
-
226
-
227
-
228
-
229
-
230
-
231
-
232
-
233
-
234
-
235
-
236
-
237
-
238
-
239
-
240
-
241
-
242
-
243
-
244
-
245
-
246
-
247
-
248
-
249
-
250
-
251
-
252
-
253
-
254
-
255
-
256
-
257
-
258
-
259
-
260
-
261
-
262
-
263
-
264
-
265
-
266
-
267
-
268
 |
 |

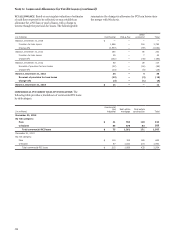
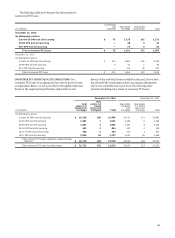
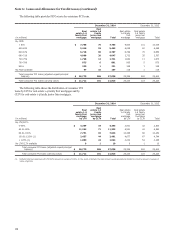
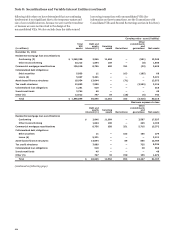
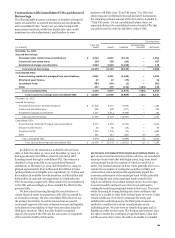
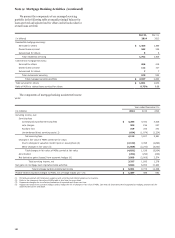
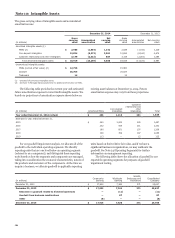
Note 8: Securitizations and Variable Interest Entities (continued)
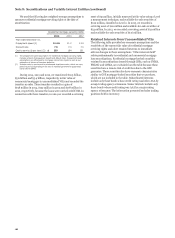
We used the following key weighted-average assumptions to
measure residential mortgage servicing rights at the date of
securitization:
Residential mortgage servicing rights
2014 2013 2012
Year ended December 31,
Prepayment speed (1) 12.4% 11.2 13.4
Discount rate 7.6 7.3 7.3
Cost to service ($ per loan) (2) $ 259 184 151
(1) The prepayment speed assumption for residential mortgage servicing rights
includes a blend of prepayment speeds and default rates. Prepayment speed
assumptions are influenced by mortgage interest rate inputs as well as our
estimation of drivers of borrower behavior.
(2) Includes costs to service and unreimbursed foreclosure costs, which can vary
period to period depending on the mix of modified government-guaranteed
loans sold to GNMA.
During 2014, 2013 and 2012, we transferred $10.3 billion,
$5.6 billion and $3.4 billion, respectively, in fair value of
commercial mortgages to unconsolidated VIEs and recorded the
transfers as sales. These transfers resulted in a gain of
$198 million in 2014, $152 million in 2013 and $178 million in
2012, respectively, because the loans were carried at LOCOM. In
connection with these transfers, in 2014 we recorded a servicing
asset of $99 million, initially measured at fair value using a Level
3 measurement technique, and available-for-sale securities of
$100 million, classified as Level 2. In 2013, we recorded a
servicing asset of $20 million and available-for-sale securities of
$54 million. In 2012, we recorded a servicing asset of $13 million
and available-for-sale securities of $116 million.
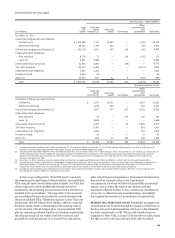
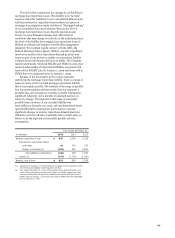
Retained Interests from Unconsolidated VIEs
The following table provides key economic assumptions and the
sensitivity of the current fair value of residential mortgage
servicing rights and other retained interests to immediate
adverse changes in those assumptions. “Other interests held”
relate predominantly to residential and commercial mortgage
loan securitizations. Residential mortgage-backed securities
retained in securitizations issued through GSEs, such as FNMA,
FHLMC and GNMA, are excluded from the table because these
securities have a remote risk of credit loss due to the GSE
guarantee. These securities also have economic characteristics
similar to GSE mortgage-backed securities that we purchase,
which are not included in the table. Subordinated interests
include only those bonds whose credit rating was below AAA by
a major rating agency at issuance. Senior interests include only
those bonds whose credit rating was AAA by a major rating
agency at issuance. The information presented excludes trading
positions held in inventory.
186