Wells Fargo 2014 Annual Report Download - page 154
Download and view the complete annual report
Please find page 154 of the 2014 Wells Fargo annual report below. You can navigate through the pages in the report by either clicking on the pages listed below, or by using the keyword search tool below to find specific information within the annual report.-
 1
1 -
2
-
3
-
4
-
5
-
6
-
7
-
8
-
9
-
10
-
11
-
12
-
13
-
14
-
15
-
16
-
17
-
18
-
19
-
20
-
21
-
22
-
23
-
24
-
25
-
26
-
27
-
28
-
29
-
30
-
31
-
32
-
33
-
34
-
35
-
36
-
37
-
38
-
39
-
40
-
41
-
42
-
43
-
44
-
45
-
46
-
47
-
48
-
49
-
50
-
51
-
52
-
53
-
54
-
55
-
56
-
57
-
58
-
59
-
60
-
61
-
62
-
63
-
64
-
65
-
66
-
67
-
68
-
69
-
70
-
71
-
72
-
73
-
74
-
75
-
76
-
77
-
78
-
79
-
80
-
81
-
82
-
83
-
84
-
85
-
86
-
87
-
88
-
89
-
90
-
91
-
92
-
93
-
94
-
95
-
96
-
97
-
98
-
99
-
100
-
101
-
102
-
103
-
104
-
105
-
106
-
107
-
108
-
109
-
110
-
111
-
112
-
113
-
114
-
115
-
116
-
117
-
118
-
119
-
120
-
121
-
122
-
123
-
124
-
125
-
126
-
127
-
128
-
129
-
130
-
131
-
132
-
133
-
134
-
135
-
136
-
137
-
138
-
139
-
140
-
141
-
142
-
143
-
 144
144 -
 145
145 -
 146
146 -
 147
147 -
 148
148 -
 149
149 -
 150
150 -
 151
151 -
 152
152 -
 153
153 -
 154
154 -
 155
155 -
 156
156 -
 157
157 -
 158
158 -
 159
159 -
 160
160 -
 161
161 -
 162
162 -
 163
163 -
 164
164 -
165
-
166
-
167
-
168
-
169
-
170
-
171
-
172
-
173
-
174
-
175
-
176
-
177
-
178
-
179
-
180
-
181
-
182
-
183
-
184
-
185
-
186
-
187
-
188
-
189
-
190
-
191
-
192
-
193
-
194
-
195
-
196
-
197
-
198
-
199
-
200
-
201
-
202
-
203
-
204
-
205
-
206
-
207
-
208
-
209
-
210
-
211
-
212
-
213
-
214
-
215
-
216
-
217
-
218
-
219
-
220
-
221
-
222
-
223
-
224
-
225
-
226
-
227
-
228
-
229
-
230
-
231
-
232
-
233
-
234
-
235
-
236
-
237
-
238
-
239
-
240
-
241
-
242
-
243
-
244
-
245
-
246
-
247
-
248
-
249
-
250
-
251
-
252
-
253
-
254
-
255
-
256
-
257
-
258
-
259
-
260
-
261
-
262
-
263
-
264
-
265
-
266
-
267
-
268
 |
 |

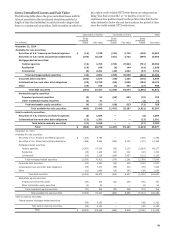
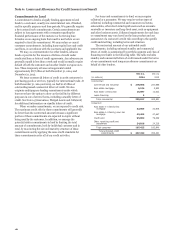
Note 5: Investment Securities
The following table provides the amortized cost and fair value by are carried at amortized cost. The net unrealized gains (losses)
major categories of available-for-sale securities, which are for available-for-sale securities are reported on an after-tax basis
carried at fair value, and held-to-maturity debt securities, which as a component of cumulative OCI.
Gross Gross
Amortized unrealized unrealized
(in millions) Cost gains losses Fair value
December 31, 2014
Available-for-sale securities:
Securities of U.S. Treasury and federal agencies $ 25,898 44 (138) 25,804
Securities of U.S. states and political subdivisions 43,939 1,504 (499) 44,944
Mortgage-backed securities:
Federal agencies 107,850 2,990 (751) 110,089
Residential 8,213 1,080 (24) 9,269
Commercial 16,248 803 (57) 16,994
Total mortgage-backed securities 132,311 4,873 (832) 136,352
Corporate debt securities 14,211 745 (170) 14,786
Collateralized loan and other debt obligations (1) 25,137 408 (184) 25,361
Other (2) 6,251 295 (27) 6,519
Total debt securities 247,747 7,869 (1,850) 253,766
Marketable equity securities:
Perpetual preferred securities 1,622 148 (70) 1,700
Other marketable equity securities 284 1,694 (2) 1,976
Total marketable equity securities 1,906 1,842 (72) 3,676
Total available-for-sale securities 249,653 9,711 (1,922) 257,442
Held-to-maturity securities:
Securities of U.S. Treasury and federal agencies 40,886 670 (8) 41,548
Securities of U.S. states and political subdivisions 1,962 27 — 1,989
Federal agency mortgage-backed securities 5,476 165 — 5,641
Collateralized loans and other debt obligations (1) 1,404 — (13) 1,391
Other (2) 5,755 35 — 5,790
Total held-to-maturity securities 55,483 897 (21) 56,359
Total (3) $ 305,136 10,608 (1,943) 313,801
December 31, 2013
Available-for-sale securities:
Securities of U.S. Treasury and federal agencies $ 6,592 17 (329) 6,280
Securities of U.S. states and political subdivisions 42,171 1,092 (727) 42,536
Mortgage-backed securities:
Federal agencies 119,303 1,902 (3,614) 117,591
Residential 11,060 1,433 (40) 12,453
Commercial 17,689 1,173 (115) 18,747
Total mortgage-backed securities 148,052 4,508 (3,769) 148,791
Corporate debt securities
Collateralized loan and other debt obligations (1)
Other (2)
Total debt securities
20,391
19,610
9,232
246,048
976
642
426
7,661
(140)
(93)
(29)
(5,087)
21,227
20,159
9,629
248,622
Marketable equity securities:
Perpetual preferred securities 1,703 222 (60) 1,865
Other marketable equity securities 336 1,188 (4) 1,520
Total marketable equity securities 2,039 1,410 (64) 3,385
Total available-for-sale-securities 248,087 9,071 (5,151) 252,007
Held-to-maturity securities:
Federal agency mortgage-backed securities 6,304 — (99) 6,205
Other (2) 6,042 — — 6,042
Total held-to-maturity securities 12,346 — (99) 12,247
Total (3) $ 260,433 9,071 (5,250) 264,254
(1) The available-for-sale portfolio includes collateralized debt obligations (CDOs) with a cost basis and fair value of $364 million and $500 million, respectively, at
December 31, 2014, and $509 million and $693 million, respectively at December 31, 2013. The held-to-maturity portfolio only includes collateralized loan obligations.
(2) The “Other” category of available-for-sale securities predominantly includes asset-backed securities collateralized by credit cards, student loans, home equity loans and
auto leases or loans and cash. Included in the “Other” category of held-to-maturity securities are asset-backed securities collateralized by auto leases or loans and cash
with a cost basis and fair value of $3.8 billion each at December 31, 2014, and $4.3 billion each at December 31, 2013. Also included in the “Other” category of held-to-
maturity securities are asset-backed securities collateralized by dealer floorplan loans with a cost basis of $1.9 billion and fair value of $2.0 billion at December 31, 2014,
and $1.7 billion each at December 31, 2013.
(3) At December 31, 2014 and 2013, we held no securities of any single issuer (excluding the U.S. Treasury and federal agencies) with a book value that exceeded 10% of
stockholders’ equity.
152