Wells Fargo 2014 Annual Report Download - page 168
Download and view the complete annual report
Please find page 168 of the 2014 Wells Fargo annual report below. You can navigate through the pages in the report by either clicking on the pages listed below, or by using the keyword search tool below to find specific information within the annual report.-
 1
1 -
2
-
3
-
4
-
5
-
6
-
7
-
8
-
9
-
10
-
11
-
12
-
13
-
14
-
15
-
16
-
17
-
18
-
19
-
20
-
21
-
22
-
23
-
24
-
25
-
26
-
27
-
28
-
29
-
30
-
31
-
32
-
33
-
34
-
35
-
36
-
37
-
38
-
39
-
40
-
41
-
42
-
43
-
44
-
45
-
46
-
47
-
48
-
49
-
50
-
51
-
52
-
53
-
54
-
55
-
56
-
57
-
58
-
59
-
60
-
61
-
62
-
63
-
64
-
65
-
66
-
67
-
68
-
69
-
70
-
71
-
72
-
73
-
74
-
75
-
76
-
77
-
78
-
79
-
80
-
81
-
82
-
83
-
84
-
85
-
86
-
87
-
88
-
89
-
90
-
91
-
92
-
93
-
94
-
95
-
96
-
97
-
98
-
99
-
100
-
101
-
102
-
103
-
104
-
105
-
106
-
107
-
108
-
109
-
110
-
111
-
112
-
113
-
114
-
115
-
116
-
117
-
118
-
119
-
120
-
121
-
122
-
123
-
124
-
125
-
126
-
127
-
128
-
129
-
130
-
131
-
132
-
133
-
134
-
135
-
136
-
137
-
138
-
139
-
140
-
141
-
142
-
143
-
144
-
145
-
146
-
147
-
148
-
149
-
150
-
151
-
152
-
153
-
154
-
155
-
156
-
157
-
 158
158 -
 159
159 -
 160
160 -
 161
161 -
 162
162 -
 163
163 -
 164
164 -
 165
165 -
 166
166 -
 167
167 -
 168
168 -
 169
169 -
 170
170 -
 171
171 -
 172
172 -
 173
173 -
 174
174 -
 175
175 -
 176
176 -
 177
177 -
 178
178 -
179
-
180
-
181
-
182
-
183
-
184
-
185
-
186
-
187
-
188
-
189
-
190
-
191
-
192
-
193
-
194
-
195
-
196
-
197
-
198
-
199
-
200
-
201
-
202
-
203
-
204
-
205
-
206
-
207
-
208
-
209
-
210
-
211
-
212
-
213
-
214
-
215
-
216
-
217
-
218
-
219
-
220
-
221
-
222
-
223
-
224
-
225
-
226
-
227
-
228
-
229
-
230
-
231
-
232
-
233
-
234
-
235
-
236
-
237
-
238
-
239
-
240
-
241
-
242
-
243
-
244
-
245
-
246
-
247
-
248
-
249
-
250
-
251
-
252
-
253
-
254
-
255
-
256
-
257
-
258
-
259
-
260
-
261
-
262
-
263
-
264
-
265
-
266
-
267
-
268
 |
 |

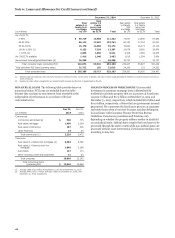
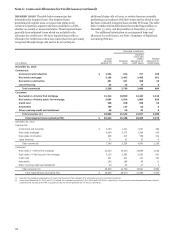
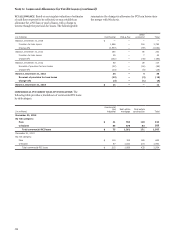
Note 6: Loans and Allowance for Credit Losses (continued)
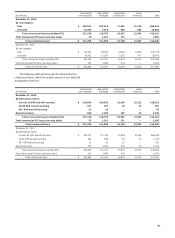
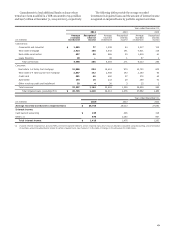
CONSUMER CREDIT QUALITY INDICATORS We have various Many of our loss estimation techniques used for the
classes of consumer loans that present unique risks. Loan allowance for credit losses rely on delinquency-based models;
delinquency, FICO credit scores and LTV for loan types are therefore, delinquency is an important indicator of credit quality
common credit quality indicators that we monitor and utilize in and the establishment of our allowance for credit losses. The
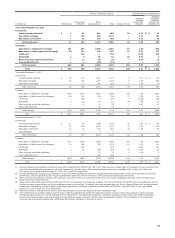
our evaluation of the appropriateness of the allowance for credit following table provides the outstanding balances of our
losses for the consumer portfolio segment. consumer portfolio by delinquency status.
Real estate Real estate Other
(in millions)
1-4 family
first
mortgage
1-4 family
junior lien
mortgage Credit card Automobile
revolving
credit and
installment Total
December 31, 2014
By delinquency status:
Current-29 DPD $ 208,642 58,182 30,356 54,365 35,356 386,901
30-59 DPD 2,415 398 239 1,056 180 4,288
60-89 DPD 993 220 160 235 111 1,719
90-119 DPD 488 158 136 78 82 942
120-179 DPD 610 194 227 5 21 1,057
180+ DPD 4,258 464 1 1 13 4,737
Government insured/guaranteed loans (1) 26,268 — — — — 26,268
Total consumer loans (excluding PCI) 243,674 59,616 31,119 55,740 35,763 425,912
Total consumer PCI loans (carrying value) 21,712 101 — — — 21,813
Total consumer loans $ 265,386 59,717 31,119 55,740 35,763 447,725
December 31, 2013
By delinquency status:
Current-29 DPD $ 193,371 64,230 26,218 49,699 31,944 365,462
30-59 DPD 2,784 461 201 852 179 4,477
60-89 DPD 1,157 253 143 186 111 1,850
90-119 DPD 587 182 124 66 76 1,035
120-179 DPD 747 216 195 4 20 1,182
180+ DPD 5,024 485 1 1 7 5,518
Government insured/guaranteed loans (1) 30,737 — — — 10,712 41,449
Total consumer loans (excluding PCI) 234,407 65,827 26,882 50,808 43,049 420,973
Total consumer PCI loans (carrying value) 24,100 123 — — — 24,223
Total consumer loans $ 258,507 65,950 26,882 50,808 43,049 445,196
(1) Represents loans whose repayments are predominantly insured by the FHA or guaranteed by the VA and student loans whose repayments are predominantly guaranteed by
agencies on behalf of the U.S. Department of Education under the Federal Family Education Loan Program (FFELP). Loans insured/guaranteed by the FHA/VA and 90+ DPD
totaled $16.2 billion at December 31, 2014, compared with $20.8 billion at December 31, 2013. On June 30, 2014, we transferred all government guaranteed student loans
to loans held for sale. Student loans 90+ DPD totaled $900 million at December 31, 2013.
Of the $6.7 billion of consumer loans not government
insured/guaranteed that are 90 days or more past due at
December 31, 2014, $873 million was accruing, compared with
$7.7 billion past due and $902 million accruing at December 31,
2013.
Real estate 1-4 family first mortgage loans 180 days or more
past due totaled $4.3 billion, or 1.7% of total first mortgages
(excluding PCI), at December 31, 2014, compared with
$5.0 billion, or 2.1%, at December 31, 2013.
The following table provides a breakdown of our consumer
portfolio by updated FICO. We obtain FICO scores at loan
origination and the scores are updated at least quarterly. The
majority of our portfolio is underwritten with a FICO score of
680 and above. FICO is not available for certain loan types and
may not be obtained if we deem it unnecessary due to strong
collateral and other borrower attributes, primarily security-
based loans of $5.9 billion at December 31, 2014, and
$5.0 billion at December 31, 2013.
166