Wells Fargo 2014 Annual Report Download - page 247
Download and view the complete annual report
Please find page 247 of the 2014 Wells Fargo annual report below. You can navigate through the pages in the report by either clicking on the pages listed below, or by using the keyword search tool below to find specific information within the annual report.-
 1
1 -
2
-
3
-
4
-
5
-
6
-
7
-
8
-
9
-
10
-
11
-
12
-
13
-
14
-
15
-
16
-
17
-
18
-
19
-
20
-
21
-
22
-
23
-
24
-
25
-
26
-
27
-
28
-
29
-
30
-
31
-
32
-
33
-
34
-
35
-
36
-
37
-
38
-
39
-
40
-
41
-
42
-
43
-
44
-
45
-
46
-
47
-
48
-
49
-
50
-
51
-
52
-
53
-
54
-
55
-
56
-
57
-
58
-
59
-
60
-
61
-
62
-
63
-
64
-
65
-
66
-
67
-
68
-
69
-
70
-
71
-
72
-
73
-
74
-
75
-
76
-
77
-
78
-
79
-
80
-
81
-
82
-
83
-
84
-
85
-
86
-
87
-
88
-
89
-
90
-
91
-
92
-
93
-
94
-
95
-
96
-
97
-
98
-
99
-
100
-
101
-
102
-
103
-
104
-
105
-
106
-
107
-
108
-
109
-
110
-
111
-
112
-
113
-
114
-
115
-
116
-
117
-
118
-
119
-
120
-
121
-
122
-
123
-
124
-
125
-
126
-
127
-
128
-
129
-
130
-
131
-
132
-
133
-
134
-
135
-
136
-
137
-
138
-
139
-
140
-
141
-
142
-
143
-
144
-
145
-
146
-
147
-
148
-
149
-
150
-
151
-
152
-
153
-
154
-
155
-
156
-
157
-
158
-
159
-
160
-
161
-
162
-
163
-
164
-
165
-
166
-
167
-
168
-
169
-
170
-
171
-
172
-
173
-
174
-
175
-
176
-
177
-
178
-
179
-
180
-
181
-
182
-
183
-
184
-
185
-
186
-
187
-
188
-
189
-
190
-
191
-
192
-
193
-
194
-
195
-
196
-
197
-
198
-
199
-
200
-
201
-
202
-
203
-
204
-
205
-
206
-
207
-
208
-
209
-
210
-
211
-
212
-
213
-
214
-
215
-
216
-
217
-
218
-
219
-
220
-
221
-
222
-
223
-
224
-
225
-
226
-
227
-
228
-
229
-
230
-
231
-
232
-
233
-
234
-
235
-
236
-
 237
237 -
 238
238 -
 239
239 -
 240
240 -
 241
241 -
 242
242 -
 243
243 -
 244
244 -
 245
245 -
 246
246 -
 247
247 -
 248
248 -
 249
249 -
 250
250 -
 251
251 -
 252
252 -
 253
253 -
 254
254 -
 255
255 -
 256
256 -
 257
257 -
258
-
259
-
260
-
261
-
262
-
263
-
264
-
265
-
266
-
267
-
268
 |
 |

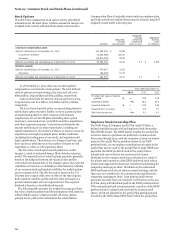
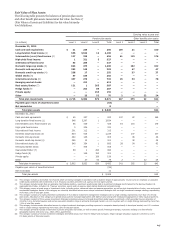
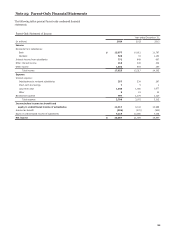
Fair Value of Plan Assets
The following table presents the balances of pension plan assets
and other benefit plan assets measured at fair value. See Note 17
(Fair Values of Assets and Liabilities) for fair value hierarchy
level definitions.
Carrying value at year end
Pension plan assets Other benefits plan assets
(in millions) Level 1 Level 2 Level 3 Total Level 1 Level 2 Level 3 Total
December 31, 2014
Cash and cash equivalents $ 31 224 — 255 139 21 — 160
Long duration fixed income (1) 556 3,622 12 4,190 — — — —
Intermediate (core) fixed income (2) 127 329 — 456 61 115 — 176
High-yield fixed income 1 321 5 327 — — — —
International fixed income 53 284 — 337 — — — —
Domestic large-cap stocks (3) 833 375 — 1,208 — 102 — 102
Domestic mid-cap stocks 252 140 — 392 — 47 — 47
Domestic small-cap stocks (4) 238 17 — 255 — 37 — 37
Global stocks (5) 47 155 — 202 — — — —
International stocks (6) 457 276 — 733 25 53 — 78
Emerging market stocks — 412 — 412 — — — —
Real estate/timber (7) 121 1 265 387 — — — —
Hedge funds (8) — 203 84 287 — — — —
Private equity — — 155 155 — — — —
Other — 23 52 75 2 — 22 24
Total plan investments $ 2,716 6,382 573 9,671 227 375 22 624
Payable upon return of securities loaned (53) —
Net receivables 8 —
Total plan assets $ 9,626 624
December 31, 2013
Cash and cash equivalents $ 65 357 — 422 147 22 — 169
Long duration fixed income (1) 546 3,287 1 3,834 — — — —
Intermediate (core) fixed income (2) 86 339 — 425 64 115 — 179
High-yield fixed income 5 326 — 331 — — — —
International fixed income 201 112 — 313 — — — —
Domestic large-cap stocks (3) 824 415 — 1,239 — 107 — 107
Domestic mid-cap stocks 260 145 — 405 — 46 — 46
Domestic small-cap stocks (4) 286 15 — 301 — 38 — 38
International stocks (6) 540 354 1 895 28 54 — 82
Emerging market stocks — 405 — 405 — — — —
Real estate/timber (7) 89 1 294 384 — — — —
Hedge funds (8) — 149 152 301 — — — —
Private equity — — 158 158 — — — —
Other — 27 52 79 2 — 22 24
Total plan investments $ 2,902 5,932 658 9,492 241 382 22 645
Payable upon return of securities loaned (94) —
Net receivables 11 —
Total plan assets $ 9,409
(1) This category includes a diversified mix of assets which are being managed in accordance with a duration target of approximately 10 years and an emphasis on corporate
credit bonds combined with investments in U.S. Treasury securities and other U.S. agency and non-agency bonds.
(2) This category includes assets that are primarily intermediate duration, investment grade bonds held in investment strategies benchmarked to the Barclays Capital U.S.
Aggregate Bond Index. Includes U.S. Treasury securities, agency and non-agency asset-backed bonds and corporate bonds.
(3) This category covers a broad range of investment styles, including active, enhanced index and passive approaches, as well as style characteristics of value, core and growth
emphasized strategies. Assets in this category are currently diversified across seven unique investment strategies with no single investment manager strategy representing
more than 2.5% of total plan assets.
(4) This category consists of a highly diversified combination of four distinct investment management strategies with no single strategy representing more than 2% of total
plan assets. Allocations in this category are spread across actively managed approaches with distinct value and growth emphasized approaches in fairly equal proportions.
(5) This category consists of three unique investment strategies providing exposure to broadly diversified, global equity investments, which generally have an allocation of
40-60% in U.S. domiciled equities and and an equivalent allocation range in primarily developed market, non-U.S. equities, with no single strategy representing more than
1.5% of total Plan assets.
(6) This category includes assets diversified across six unique investment strategies providing exposure to companies based primarily in developed market, non-U.S. countries
with no single strategy representing more than 2.5% of total plan assets.
(7) This category primarily includes investments in private and public real estate, as well as timber specific limited partnerships; real estate holdings are diversified by
geographic location and sector (e.g., retail, office, apartments).
(8) This category consists of several investment strategies diversified across more than 30 hedge fund managers. Single manager allocation exposure is limited to 0.15%
(15 basis points) of total plan assets.
645
245