Wells Fargo 2014 Annual Report Download - page 227
Download and view the complete annual report
Please find page 227 of the 2014 Wells Fargo annual report below. You can navigate through the pages in the report by either clicking on the pages listed below, or by using the keyword search tool below to find specific information within the annual report.-
 1
1 -
2
-
3
-
4
-
5
-
6
-
7
-
8
-
9
-
10
-
11
-
12
-
13
-
14
-
15
-
16
-
17
-
18
-
19
-
20
-
21
-
22
-
23
-
24
-
25
-
26
-
27
-
28
-
29
-
30
-
31
-
32
-
33
-
34
-
35
-
36
-
37
-
38
-
39
-
40
-
41
-
42
-
43
-
44
-
45
-
46
-
47
-
48
-
49
-
50
-
51
-
52
-
53
-
54
-
55
-
56
-
57
-
58
-
59
-
60
-
61
-
62
-
63
-
64
-
65
-
66
-
67
-
68
-
69
-
70
-
71
-
72
-
73
-
74
-
75
-
76
-
77
-
78
-
79
-
80
-
81
-
82
-
83
-
84
-
85
-
86
-
87
-
88
-
89
-
90
-
91
-
92
-
93
-
94
-
95
-
96
-
97
-
98
-
99
-
100
-
101
-
102
-
103
-
104
-
105
-
106
-
107
-
108
-
109
-
110
-
111
-
112
-
113
-
114
-
115
-
116
-
117
-
118
-
119
-
120
-
121
-
122
-
123
-
124
-
125
-
126
-
127
-
128
-
129
-
130
-
131
-
132
-
133
-
134
-
135
-
136
-
137
-
138
-
139
-
140
-
141
-
142
-
143
-
144
-
145
-
146
-
147
-
148
-
149
-
150
-
151
-
152
-
153
-
154
-
155
-
156
-
157
-
158
-
159
-
160
-
161
-
162
-
163
-
164
-
165
-
166
-
167
-
168
-
169
-
170
-
171
-
172
-
173
-
174
-
175
-
176
-
177
-
178
-
179
-
180
-
181
-
182
-
183
-
184
-
185
-
186
-
187
-
188
-
189
-
190
-
191
-
192
-
193
-
194
-
195
-
196
-
197
-
198
-
199
-
200
-
201
-
202
-
203
-
204
-
205
-
206
-
207
-
208
-
209
-
210
-
211
-
212
-
213
-
214
-
215
-
216
-
 217
217 -
 218
218 -
 219
219 -
 220
220 -
 221
221 -
 222
222 -
 223
223 -
 224
224 -
 225
225 -
 226
226 -
 227
227 -
 228
228 -
 229
229 -
 230
230 -
 231
231 -
 232
232 -
 233
233 -
 234
234 -
 235
235 -
 236
236 -
 237
237 -
238
-
239
-
240
-
241
-
242
-
243
-
244
-
245
-
246
-
247
-
248
-
249
-
250
-
251
-
252
-
253
-
254
-
255
-
256
-
257
-
258
-
259
-
260
-
261
-
262
-
263
-
264
-
265
-
266
-
267
-
268
 |
 |

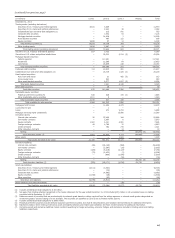
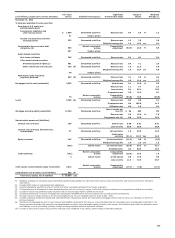
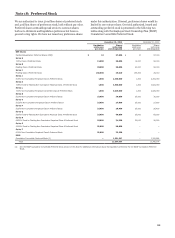
($ in millions, except cost to service amounts) Fair Value
Level 3 Valuation Technique(s) Significant
Unobservable Input Range of
Inputs Weighted
Average (1)
December 31, 2014
Trading and available-for-sale securities:
Securities of U.S. states and
political subdivisions:
Government, healthcare and
other revenue bonds $ 1,900 Discounted cash flow Discount rate 0.4 -5.6 % 1.5
61 Vendor priced
Auction rate securities and other
municipal bonds 323 Discounted cash flow Discount rate 1.5 -7.6 3.9
Weighted average life 1.3 -19.4 yrs 6.4
Collateralized loan and other debt Market comparable Comparability
obligations (2) 565 pricing adjustment (53.9) -25.0 % 0.9
967 Vendor priced
Asset-backed securities:
Auto loans and leases 245 Discounted cash flow Discount rate 0.4 -0.4 0.4
Other asset-backed securities:
Diversified payment rights (3) 661 Discounted cash flow Discount rate 0.9 -7.1 2.9
Other commercial and consumer 750 (4) Discounted cash flow Discount rate 1.9 -21.5 5.0
Weighted average life 1.6 -10.7 yrs 4.0
40 Vendor priced
Marketable equity securities:
perpetual preferred 663 (5) Discounted cash flow Discount rate 4.1 -9.3 % 6.6
Weighted average life 1.0 -11.8 yrs 9.7
Mortgages held for sale (residential) 2,235 Discounted cash flow Default rate 0.4 -15.0 % 2.6
Discount rate 1.1 -7.7 5.2
Loss severity 0.1 -26.4 18.3
Prepayment rate 2.0 -15.5 8.1
78 Market comparable
pricing Comparability
adjustment (93.0) -10.0 (30.0)
Loans 5,788 (6) Discounted cash flow Discount rate 0.0 -3.8 3.1
Prepayment rate 0.6 -100.0 11.2
Utilization rate 0.0 -1.0 0.4
Cost to service per
Mortgage servicing rights (residential) 12,738 Discounted cash flow loan (7) $ 86 -683 179
Discount rate 5.9 -16.9 % 7.6
Prepayment rate (8) 8.0 -22.0 12.5
Net derivative assets and (liabilities):
Interest rate contracts 196 Discounted cash flow Default rate 0.00 -0.02 0.01
Loss severity 50.0 -50.0 50.0
Interest rate contracts: derivative loan
commitments 97 Discounted cash flow Fall-out factor 1.0 -99.0 24.5
Initial-value
servicing (31.1) -113.3 bps 46.5
Equity contracts 162 Discounted cash flow Conversion factor (11.2) -0.0 % (8.4)
Weighted average life 1.0 -2.0 yrs 1.3
(246) Option model Correlation factor (56.0) -96.3 % 42.1
Volatility factor 8.3 -80.9 28.3
Credit contracts (192) Market comparable
pricing Comparability
adjustment (28.6) -26.3 1.8
3 Option model Credit spread 0.0 -17.0 0.9
Loss severity 11.5 -72.5 48.7
Other assets: nonmarketable equity investments 2,512 Market comparable
pricing Comparability
adjustment (19.7) -(4.0) (14.7)
Insignificant Level 3 assets, net of liabilities 507 (9)
Total level 3 assets, net of liabilities $ 30,054 (10)
(1) Weighted averages are calculated using outstanding unpaid principal balance for cash instruments such as loans and securities, and notional amounts for derivative
instruments.
(2) Includes $500 million of collateralized debt obligations.
(3) Securities backed by specified sources of current and future receivables generated from foreign originators.
(4) Consists primarily of investments in asset-backed securities that are revolving in nature, in which the timing of advances and repayments of principal are uncertain.
(5) Consists of auction rate preferred equity securities with no maturity date that are callable by the issuer.
(6) Consists predominantly of reverse mortgage loans securitized with GNMA which were accounted for as secured borrowing transactions.
(7) The high end of the range of inputs is for servicing modified loans. For non-modified loans the range is $86 - $270.
(8) Includes a blend of prepayment speeds and expected defaults. Prepayment speeds are influenced by mortgage interest rates as well as our estimation of drivers of
borrower behavior.
(9) Represents the aggregate amount of Level 3 assets and liabilities measured at fair value on a recurring basis that are individually and in the aggregate insignificant. The
amount includes corporate debt securities, mortgage-backed securities, other marketable equity securities, other assets, other liabilities and certain net derivative assets
and liabilities, such as commodity contracts, foreign exchange contracts and other derivative contracts.
(10) Consists of total Level 3 assets of $32.3 billion and total Level 3 liabilities of $2.3 billion, before netting of derivative balances.
225