Wells Fargo 2014 Annual Report Download - page 181
Download and view the complete annual report
Please find page 181 of the 2014 Wells Fargo annual report below. You can navigate through the pages in the report by either clicking on the pages listed below, or by using the keyword search tool below to find specific information within the annual report.-
 1
1 -
2
-
3
-
4
-
5
-
6
-
7
-
8
-
9
-
10
-
11
-
12
-
13
-
14
-
15
-
16
-
17
-
18
-
19
-
20
-
21
-
22
-
23
-
24
-
25
-
26
-
27
-
28
-
29
-
30
-
31
-
32
-
33
-
34
-
35
-
36
-
37
-
38
-
39
-
40
-
41
-
42
-
43
-
44
-
45
-
46
-
47
-
48
-
49
-
50
-
51
-
52
-
53
-
54
-
55
-
56
-
57
-
58
-
59
-
60
-
61
-
62
-
63
-
64
-
65
-
66
-
67
-
68
-
69
-
70
-
71
-
72
-
73
-
74
-
75
-
76
-
77
-
78
-
79
-
80
-
81
-
82
-
83
-
84
-
85
-
86
-
87
-
88
-
89
-
90
-
91
-
92
-
93
-
94
-
95
-
96
-
97
-
98
-
99
-
100
-
101
-
102
-
103
-
104
-
105
-
106
-
107
-
108
-
109
-
110
-
111
-
112
-
113
-
114
-
115
-
116
-
117
-
118
-
119
-
120
-
121
-
122
-
123
-
124
-
125
-
126
-
127
-
128
-
129
-
130
-
131
-
132
-
133
-
134
-
135
-
136
-
137
-
138
-
139
-
140
-
141
-
142
-
143
-
144
-
145
-
146
-
147
-
148
-
149
-
150
-
151
-
152
-
153
-
154
-
155
-
156
-
157
-
158
-
159
-
160
-
161
-
162
-
163
-
164
-
165
-
166
-
167
-
168
-
169
-
170
-
 171
171 -
 172
172 -
 173
173 -
 174
174 -
 175
175 -
 176
176 -
 177
177 -
 178
178 -
 179
179 -
 180
180 -
 181
181 -
 182
182 -
 183
183 -
 184
184 -
 185
185 -
 186
186 -
 187
187 -
 188
188 -
 189
189 -
 190
190 -
 191
191 -
192
-
193
-
194
-
195
-
196
-
197
-
198
-
199
-
200
-
201
-
202
-
203
-
204
-
205
-
206
-
207
-
208
-
209
-
210
-
211
-
212
-
213
-
214
-
215
-
216
-
217
-
218
-
219
-
220
-
221
-
222
-
223
-
224
-
225
-
226
-
227
-
228
-
229
-
230
-
231
-
232
-
233
-
234
-
235
-
236
-
237
-
238
-
239
-
240
-
241
-
242
-
243
-
244
-
245
-
246
-
247
-
248
-
249
-
250
-
251
-
252
-
253
-
254
-
255
-
256
-
257
-
258
-
259
-
260
-
261
-
262
-
263
-
264
-
265
-
266
-
267
-
268
 |
 |

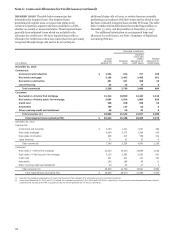
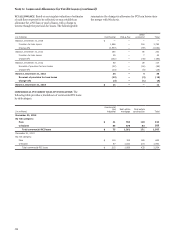
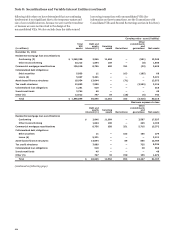
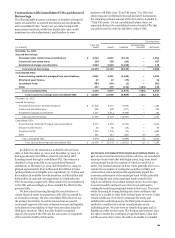
Note 7: Premises, Equipment, Lease Commitments and Other Assets
(in millions)
Dec 31,
2014
Dec 31,
2013
Land $ 1,748 1,759
Buildings
Furniture and equipment
Leasehold improvements
Premises and equipment leased under
capital leases
8,155
7,215
2,009
79
7,931
7,517
1,939
82
Total premises and equipment
Less: Accumulated depreciation and
amortization
19,206
10,463
19,228
10,072
Net book value, premises and
equipment $ 8,743 9,156
Depreciation and amortization expense for premises and
equipment was $1.2 billion, $1.2 billion and $1.3 billion in 2014,
2013 and 2012, respectively.
Dispositions of premises and equipment, included in
noninterest expense, resulted in a net gain of $28 million in
2014, a net loss of $15 million in 2013 and a net gain of
$7 million in 2012.
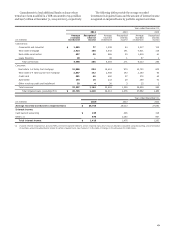
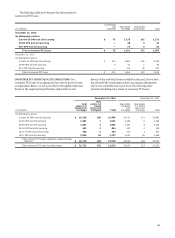
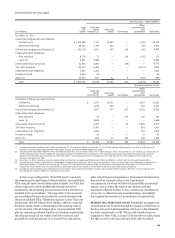
We have obligations under a number of noncancelable
operating leases for premises and equipment. The leases
predominantly expire over the next 15 years, with the longest
expiring in 2105, and many provide for periodic adjustment of
rentals based on changes in various economic indicators. Some
leases also include a renewal option. The following table
provides the future minimum payments under capital leases and
noncancelable operating leases, net of sublease rentals, with
terms greater than one year as of December 31, 2014.
(in millions) Operating
leases Capital
leases
Year ended December 31,
2015 $ 1,148 2
2016 1,033 2
2017 904 3
2018 777 3
2019 672 3
Thereafter 2,521 9
Total minimum lease payments $ 7,055 22
Executory costs $ (8)
Amounts representing interest (5)
Present value of net minimum lease
payments $ 9
Operating lease rental expense (predominantly for
premises), net of rental income, was $1.3 billion, $1.3 billion and
$1.1 billion in 2014, 2013 and 2012, respectively.
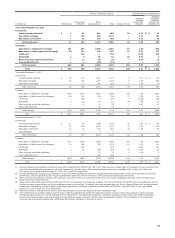
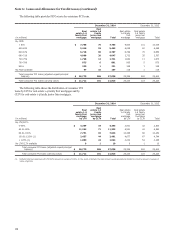
The components of other assets were:
(in millions)
Nonmarketable equity investments:
Cost method:
Dec 31,
2014
Dec 31,
2013
Private equity and other
Federal bank stock
$ 2,300
4,733
2,308
4,670
Total cost method 7,033 6,978
Equity method:
LIHTC investments (1)
Private equity and other
Total equity method
Fair value (2)
Total nonmarketable equity
investments
Corporate/bank-owned life insurance
Accounts receivable (3)
Interest receivable
Core deposit intangibles
Customer relationship and other amortized
intangibles
Foreclosed assets:
Residential real estate:
7,278
5,132
12,410
2,512
21,955
18,982
27,151
4,871
3,561
857
6,209
5,782
11,991
1,386
20,355
18,738
21,422
5,019
4,674
1,084
Government insured/guaranteed (3)
Non-government insured/guaranteed
Non-residential real estate
Operating lease assets
Due from customers on acceptances
Other (4)
Total other assets $
982
671
956
2,714
201
16,156
99,057
2,093
814
1,030
2,047
279
8,787
86,342
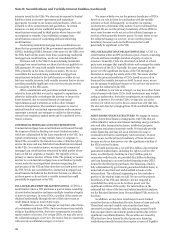
(1) Represents low income housing tax credit investments.
(2) Represents nonmarketable equity investments for which we have elected the
fair value option. See Note 17 (Fair Values of Assets and Liabilities) for
additional information.
(3) Upon adoption of ASU 2014-14, Classification of Certain Government-
Guaranteed mortgage Loans Upon Foreclosure, certain government guaranteed
residential real estate mortgage loans upon foreclosure are included in
Accounts Receivable. Previously, these assets were included in government
insured/guaranteed residential real estate foreclosed assets. This guidance was
adopted during fourth quarter 2014, effective as of January 1, 2014. For more
information on the classification of certain government-guaranteed mortgage
loans upon foreclosure, see Note 1 (Summary of Significant Accounting
Policies).
(4) Includes derivatives designated as hedging instruments, free-standing
derivatives (economic hedges), and derivative loan commitments, which are
carried at fair value. See Note 16 (Derivatives) for additional information.
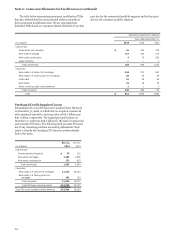
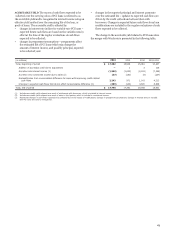
Income (expense) related to nonmarketable equity
investments was:
Year ended December 31,
(in millions) 2014 2013 2012
Net realized gains from
nonmarketable equity investments $ 1,479 1,158 1,086
All other (741) (287) (185)
Total $ 738 871 901
179