Wells Fargo 2014 Annual Report Download - page 8
Download and view the complete annual report
Please find page 8 of the 2014 Wells Fargo annual report below. You can navigate through the pages in the report by either clicking on the pages listed below, or by using the keyword search tool below to find specific information within the annual report.-
 1
1 -
 2
2 -
 3
3 -
 4
4 -
 5
5 -
 6
6 -
 7
7 -
 8
8 -
 9
9 -
 10
10 -
 11
11 -
 12
12 -
 13
13 -
 14
14 -
 15
15 -
 16
16 -
 17
17 -
 18
18 -
 19
19 -
20
-
21
-
22
-
23
-
24
-
25
-
26
-
27
-
28
-
29
-
30
-
31
-
32
-
33
-
34
-
35
-
36
-
37
-
38
-
39
-
40
-
41
-
42
-
43
-
44
-
45
-
46
-
47
-
48
-
49
-
50
-
51
-
52
-
53
-
54
-
55
-
56
-
57
-
58
-
59
-
60
-
61
-
62
-
63
-
64
-
65
-
66
-
67
-
68
-
69
-
70
-
71
-
72
-
73
-
74
-
75
-
76
-
77
-
78
-
79
-
80
-
81
-
82
-
83
-
84
-
85
-
86
-
87
-
88
-
89
-
90
-
91
-
92
-
93
-
94
-
95
-
96
-
97
-
98
-
99
-
100
-
101
-
102
-
103
-
104
-
105
-
106
-
107
-
108
-
109
-
110
-
111
-
112
-
113
-
114
-
115
-
116
-
117
-
118
-
119
-
120
-
121
-
122
-
123
-
124
-
125
-
126
-
127
-
128
-
129
-
130
-
131
-
132
-
133
-
134
-
135
-
136
-
137
-
138
-
139
-
140
-
141
-
142
-
143
-
144
-
145
-
146
-
147
-
148
-
149
-
150
-
151
-
152
-
153
-
154
-
155
-
156
-
157
-
158
-
159
-
160
-
161
-
162
-
163
-
164
-
165
-
166
-
167
-
168
-
169
-
170
-
171
-
172
-
173
-
174
-
175
-
176
-
177
-
178
-
179
-
180
-
181
-
182
-
183
-
184
-
185
-
186
-
187
-
188
-
189
-
190
-
191
-
192
-
193
-
194
-
195
-
196
-
197
-
198
-
199
-
200
-
201
-
202
-
203
-
204
-
205
-
206
-
207
-
208
-
209
-
210
-
211
-
212
-
213
-
214
-
215
-
216
-
217
-
218
-
219
-
220
-
221
-
222
-
223
-
224
-
225
-
226
-
227
-
228
-
229
-
230
-
231
-
232
-
233
-
234
-
235
-
236
-
237
-
238
-
239
-
240
-
241
-
242
-
243
-
244
-
245
-
246
-
247
-
248
-
249
-
250
-
251
-
252
-
253
-
254
-
255
-
256
-
257
-
258
-
259
-
260
-
261
-
262
-
263
-
264
-
265
-
266
-
267
-
268
 |
 |

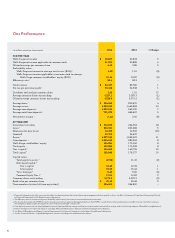
Our Performance
$ in millions, except per share amounts Change
FOR THE YEAR
WellsFargo net income
WellsFargo net income applicable to common stock
Diluted earnings per common share
Profitability ratios:
WellsFargo net income to average total assets (ROA) 1
WellsFargo net income applicable to common stock to average
WellsFargo common stockholders’ equity (ROE)
Eciency ratio 2
Total revenue
Pre-tax pre-provision profit 3
Dividends declared per common share
Average common shares outstanding
Diluted average common shares outstanding
Average loans 1
Average assets 1
Average core deposits 4
Average retail core deposits 5
Net interest margin 1
AT YEAR-END
Investment securities
Loans1
Allowance for loan losses
Goodwill
Assets 1
Core deposits 4
WellsFargo stockholders’ equity
Total equity
Tier1 capital 6
Total capital 6
Capital ratios:
Total equity to assets 1
Risk-based capital: 6
Tier1 capital
Total capital
Tier1 leverage 6
Common Equity Tier1 7
Common shares outstanding
Book value per common share
Team members (active, full-time equivalent)
()
()
–
()
()
()
()
–
()
()
()
–
1 Financial information for 2013 was revised to reflect our determination that certain factoring arrangements did not qualify as loans. See Note1 (Summary of Significant Accounting Policies)
toFinancial Statements in this Report for more information.
2 The eciency ratio is noninterest expense divided by total revenue (net interest income and noninterest income).
3 Pre-tax pre-provision profit (PTPP) is total revenue less noninterest expense. Management believes that PTPP is a useful financial measure because it enables investors and others to assess
the Company’s ability to generate capital to cover credit losses through a credit cycle.
4 Core deposits are noninterest-bearing deposits, interest-bearing checking, savings certificates, certain market rate and other savings, and certain foreign deposits (Eurodollar sweep balances).
5 Retail core deposits are total core deposits excluding Wholesale Banking core deposits and retail mortgage escrow deposits.
6 See Note 26 (Regulatory and Agency Capital Requirements) to Financial Statements in this Report for additional information.
7 See the “Financial Review – Capital Management” section in this Report for additional information.