Wells Fargo 2014 Annual Report Download - page 69
Download and view the complete annual report
Please find page 69 of the 2014 Wells Fargo annual report below. You can navigate through the pages in the report by either clicking on the pages listed below, or by using the keyword search tool below to find specific information within the annual report.-
 1
1 -
2
-
3
-
4
-
5
-
6
-
7
-
8
-
9
-
10
-
11
-
12
-
13
-
14
-
15
-
16
-
17
-
18
-
19
-
20
-
21
-
22
-
23
-
24
-
25
-
26
-
27
-
28
-
29
-
30
-
31
-
32
-
33
-
34
-
35
-
36
-
37
-
38
-
39
-
40
-
41
-
42
-
43
-
44
-
45
-
46
-
47
-
48
-
49
-
50
-
51
-
52
-
53
-
54
-
55
-
56
-
57
-
58
-
 59
59 -
 60
60 -
 61
61 -
 62
62 -
 63
63 -
 64
64 -
 65
65 -
 66
66 -
 67
67 -
 68
68 -
 69
69 -
 70
70 -
 71
71 -
 72
72 -
 73
73 -
 74
74 -
 75
75 -
 76
76 -
 77
77 -
 78
78 -
 79
79 -
80
-
81
-
82
-
83
-
84
-
85
-
86
-
87
-
88
-
89
-
90
-
91
-
92
-
93
-
94
-
95
-
96
-
97
-
98
-
99
-
100
-
101
-
102
-
103
-
104
-
105
-
106
-
107
-
108
-
109
-
110
-
111
-
112
-
113
-
114
-
115
-
116
-
117
-
118
-
119
-
120
-
121
-
122
-
123
-
124
-
125
-
126
-
127
-
128
-
129
-
130
-
131
-
132
-
133
-
134
-
135
-
136
-
137
-
138
-
139
-
140
-
141
-
142
-
143
-
144
-
145
-
146
-
147
-
148
-
149
-
150
-
151
-
152
-
153
-
154
-
155
-
156
-
157
-
158
-
159
-
160
-
161
-
162
-
163
-
164
-
165
-
166
-
167
-
168
-
169
-
170
-
171
-
172
-
173
-
174
-
175
-
176
-
177
-
178
-
179
-
180
-
181
-
182
-
183
-
184
-
185
-
186
-
187
-
188
-
189
-
190
-
191
-
192
-
193
-
194
-
195
-
196
-
197
-
198
-
199
-
200
-
201
-
202
-
203
-
204
-
205
-
206
-
207
-
208
-
209
-
210
-
211
-
212
-
213
-
214
-
215
-
216
-
217
-
218
-
219
-
220
-
221
-
222
-
223
-
224
-
225
-
226
-
227
-
228
-
229
-
230
-
231
-
232
-
233
-
234
-
235
-
236
-
237
-
238
-
239
-
240
-
241
-
242
-
243
-
244
-
245
-
246
-
247
-
248
-
249
-
250
-
251
-
252
-
253
-
254
-
255
-
256
-
257
-
258
-
259
-
260
-
261
-
262
-
263
-
264
-
265
-
266
-
267
-
268
 |
 |

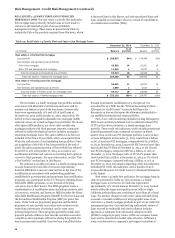
large numbers of properties in a short period of time using
market comparables and price trends for local market areas. The
primary risk associated with the use of AVMs is that the value of
an individual property may vary significantly from the average
for the market area. We have processes to periodically validate
AVMs and specific risk management guidelines addressing the
circumstances when AVMs may be used. AVMs are generally
used in underwriting to support property values on loan
originations only where the loan amount is under $250,000. We
generally require property visitation appraisals by a qualified
independent appraiser for larger residential property loans.
Additional information about AVMs and our policy for their use
can be found in Note 6 (Loans and Allowance for Credit Losses)
to Financial Statements in this Report.
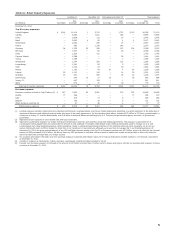
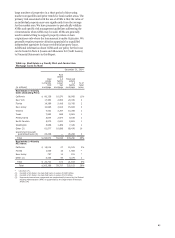
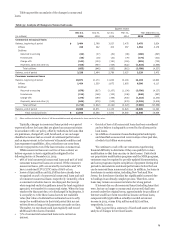
Table 24: Real Estate 1-4 Family First and Junior Lien
Mortgage Loans by State
December 31, 2014
Real
estate
Real 1-4 Total real
(in millions)
estate
1-4 family
first
mortgage
family
junior
lien
mortgage
estate
1-4
family
mortgage
% of
total
loans
Real estate 1-4 family
loans (excluding PCI):
California $ 80,338 16,570 96,908 11%
New York 17,383 2,656 20,039 2
Florida 14,289 5,419 19,708 2
New Jersey 10,995 4,813 15,808 2
Virginia 7,061 3,297 10,358 1
Texas 7,993 868 8,861 1
Pennsylvania 5,844 2,974 8,818 1
North Carolina 5,970 2,631 8,601 1
Washington 5,956 1,489 7,445 1
Other (2) 61,577 18,899 80,476 10
Government insured/
guaranteed loans (3) 26,268 — 26,268 3
Total $ 243,674 59,616 303,290 35%
Real estate 1-4 family
PCI loans:
California $ 15,014 27 15,041 2%
Florida 1,566 16 1,582 *
New Jersey 797 14 811 *
Other (1) 4,335 44 4,379 1
Total $ 21,712 101 21,813 3%
Total $ 265,386 59,717 325,103 38%
* Less than 1%.
(1) Consists of 45 states; no state had loans in excess of $540 million.
(2) Consists of 41 states; no state had loans in excess of $7.3 billion.
(3) Represents loans whose repayments are predominantly insured by the Federal
Housing Administration (FHA) or guaranteed by the Department of Veterans
Affairs (VA)
67