Wells Fargo 2014 Annual Report Download - page 45
Download and view the complete annual report
Please find page 45 of the 2014 Wells Fargo annual report below. You can navigate through the pages in the report by either clicking on the pages listed below, or by using the keyword search tool below to find specific information within the annual report.-
 1
1 -
2
-
3
-
4
-
5
-
6
-
7
-
8
-
9
-
10
-
11
-
12
-
13
-
14
-
15
-
16
-
17
-
18
-
19
-
20
-
21
-
22
-
23
-
24
-
25
-
26
-
27
-
28
-
29
-
30
-
31
-
32
-
33
-
34
-
 35
35 -
 36
36 -
 37
37 -
 38
38 -
 39
39 -
 40
40 -
 41
41 -
 42
42 -
 43
43 -
 44
44 -
 45
45 -
 46
46 -
 47
47 -
 48
48 -
 49
49 -
 50
50 -
 51
51 -
 52
52 -
 53
53 -
 54
54 -
 55
55 -
56
-
57
-
58
-
59
-
60
-
61
-
62
-
63
-
64
-
65
-
66
-
67
-
68
-
69
-
70
-
71
-
72
-
73
-
74
-
75
-
76
-
77
-
78
-
79
-
80
-
81
-
82
-
83
-
84
-
85
-
86
-
87
-
88
-
89
-
90
-
91
-
92
-
93
-
94
-
95
-
96
-
97
-
98
-
99
-
100
-
101
-
102
-
103
-
104
-
105
-
106
-
107
-
108
-
109
-
110
-
111
-
112
-
113
-
114
-
115
-
116
-
117
-
118
-
119
-
120
-
121
-
122
-
123
-
124
-
125
-
126
-
127
-
128
-
129
-
130
-
131
-
132
-
133
-
134
-
135
-
136
-
137
-
138
-
139
-
140
-
141
-
142
-
143
-
144
-
145
-
146
-
147
-
148
-
149
-
150
-
151
-
152
-
153
-
154
-
155
-
156
-
157
-
158
-
159
-
160
-
161
-
162
-
163
-
164
-
165
-
166
-
167
-
168
-
169
-
170
-
171
-
172
-
173
-
174
-
175
-
176
-
177
-
178
-
179
-
180
-
181
-
182
-
183
-
184
-
185
-
186
-
187
-
188
-
189
-
190
-
191
-
192
-
193
-
194
-
195
-
196
-
197
-
198
-
199
-
200
-
201
-
202
-
203
-
204
-
205
-
206
-
207
-
208
-
209
-
210
-
211
-
212
-
213
-
214
-
215
-
216
-
217
-
218
-
219
-
220
-
221
-
222
-
223
-
224
-
225
-
226
-
227
-
228
-
229
-
230
-
231
-
232
-
233
-
234
-
235
-
236
-
237
-
238
-
239
-
240
-
241
-
242
-
243
-
244
-
245
-
246
-
247
-
248
-
249
-
250
-
251
-
252
-
253
-
254
-
255
-
256
-
257
-
258
-
259
-
260
-
261
-
262
-
263
-
264
-
265
-
266
-
267
-
268
 |
 |

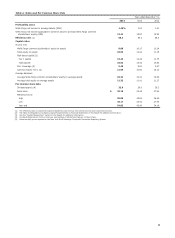
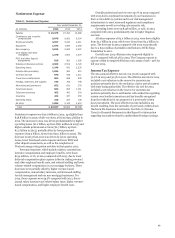
Noninterest Expense
Table 8: Noninterest Expense
Year ended December 31,
(in millions) 2014 2013 2012
Salaries $ 15,375 15,152 14,689
Commission and incentive
compensation 9,970 9,951 9,504
Employee benefits 4,597 5,033 4,611
Equipment 1,973 1,984 2,068
Net occupancy 2,925 2,895 2,857
Core deposit and other
intangibles 1,370 1,504 1,674
FDIC and other deposit
assessments 928 961 1,356
Outside professional services 2,689 2,519 2,729
Operating losses 1,249 821 2,235
Outside data processing 1,034 983 910
Contract services 975 935 1,011
Travel and entertainment 904 885 839
Postage, stationery and supplies 733 756 799
Advertising and promotion 653 610 578
Foreclosed assets 583 605 1,061
Telecommunications 453 482 500
Insurance 422 437 453
Operating leases 220 204 109
All other 1,984 2,125 2,415
Total $ 49,037 48,842 50,398
Noninterest expense was $49.0 billion in 2014, up slightly from
$48.8 billion in 2013, which was down 3% from $50.4 billion in
2012. The increase in 2014 was driven predominantly by higher
operating losses ($1.2 billion, up from $821 million in 2013) and
higher outside professional services ($2.7 billion, up from
$2.5 billion in 2013), partially offset by lower personnel
expenses ($29.9 billion, down from $30.1 billion in 2013). The
decrease in 2013 from 2012 was driven by lower operating
losses, lower foreclosed assets expense and lower FDIC and
other deposit assessments, as well as the completion of
Wachovia merger integration activities in first quarter 2012.
Personnel expenses, which include salaries, commissions,
incentive compensation and employee benefits, were down
$194 million, or 1%, in 2014 compared with 2013, due to lower
deferred compensation plan expense (offset in trading revenue)
and other employee benefit costs, and reduced staffing and lower
volume-related compensation in our mortgage business. These
decreases were partially offset by higher revenue-based
compensation, annual salary increases, and increased staffing
for risk management and our non-mortgage businesses. For
2013, these expenses were up 5% compared with 2012, due to
annual salary increases and related salary taxes, higher revenue-
based compensation, and higher employee benefit costs.
Outside professional services were up 7% in 2014 compared
with 2013 due to continued investments by our businesses in
their service delivery systems and in our risk management
infrastructure to meet increased regulatory and compliance
requirements as well as evolving cybersecurity risk.
Operating losses were up $428 million, or 52%, in 2014
compared with 2013, predominantly due to higher litigation
accruals.
All other expenses of $2.0 billion in 2014 were down slightly
from $2.1 billion in 2013, which were down from $2.4 billion in
2012. The decrease in 2013 compared with 2012 was primarily
due to a $250 million charitable contribution to Wells Fargo
Foundation in 2012.
Our full year 2014 efficiency ratio improved slightly to
58.1% compared with 58.3% in 2013. The Company expects to
operate within its targeted efficiency ratio range of 55% - 59% for
full year 2015.
Income Tax Expense
The 2014 annual effective tax rate was 30.9% compared with
32.2% in 2013 and 32.5% in 2012. The effective tax rate for 2014
included a net reduction in the reserve for uncertain tax
positions primarily due to the resolution of prior period matters
with state taxing authorities. The effective tax rate for 2013
included a net reduction in the reserve for uncertain tax
positions primarily due to settlements with authorities regarding
certain cross border transactions and tax benefits recognized
from the realization for tax purposes of a previously written
down investment. The 2012 effective tax rate included a tax
benefit resulting from the surrender of previously written-down
Wachovia life insurance investments. See Note 21 (Income
Taxes) to Financial Statements in this Report for information
regarding tax matters related to undistributed foreign earnings.
43