Wells Fargo 2014 Annual Report Download - page 191
Download and view the complete annual report
Please find page 191 of the 2014 Wells Fargo annual report below. You can navigate through the pages in the report by either clicking on the pages listed below, or by using the keyword search tool below to find specific information within the annual report.-
 1
1 -
2
-
3
-
4
-
5
-
6
-
7
-
8
-
9
-
10
-
11
-
12
-
13
-
14
-
15
-
16
-
17
-
18
-
19
-
20
-
21
-
22
-
23
-
24
-
25
-
26
-
27
-
28
-
29
-
30
-
31
-
32
-
33
-
34
-
35
-
36
-
37
-
38
-
39
-
40
-
41
-
42
-
43
-
44
-
45
-
46
-
47
-
48
-
49
-
50
-
51
-
52
-
53
-
54
-
55
-
56
-
57
-
58
-
59
-
60
-
61
-
62
-
63
-
64
-
65
-
66
-
67
-
68
-
69
-
70
-
71
-
72
-
73
-
74
-
75
-
76
-
77
-
78
-
79
-
80
-
81
-
82
-
83
-
84
-
85
-
86
-
87
-
88
-
89
-
90
-
91
-
92
-
93
-
94
-
95
-
96
-
97
-
98
-
99
-
100
-
101
-
102
-
103
-
104
-
105
-
106
-
107
-
108
-
109
-
110
-
111
-
112
-
113
-
114
-
115
-
116
-
117
-
118
-
119
-
120
-
121
-
122
-
123
-
124
-
125
-
126
-
127
-
128
-
129
-
130
-
131
-
132
-
133
-
134
-
135
-
136
-
137
-
138
-
139
-
140
-
141
-
142
-
143
-
144
-
145
-
146
-
147
-
148
-
149
-
150
-
151
-
152
-
153
-
154
-
155
-
156
-
157
-
158
-
159
-
160
-
161
-
162
-
163
-
164
-
165
-
166
-
167
-
168
-
169
-
170
-
171
-
172
-
173
-
174
-
175
-
176
-
177
-
178
-
179
-
180
-
 181
181 -
 182
182 -
 183
183 -
 184
184 -
 185
185 -
 186
186 -
 187
187 -
 188
188 -
 189
189 -
 190
190 -
 191
191 -
 192
192 -
 193
193 -
 194
194 -
 195
195 -
 196
196 -
 197
197 -
 198
198 -
 199
199 -
 200
200 -
 201
201 -
202
-
203
-
204
-
205
-
206
-
207
-
208
-
209
-
210
-
211
-
212
-
213
-
214
-
215
-
216
-
217
-
218
-
219
-
220
-
221
-
222
-
223
-
224
-
225
-
226
-
227
-
228
-
229
-
230
-
231
-
232
-
233
-
234
-
235
-
236
-
237
-
238
-
239
-
240
-
241
-
242
-
243
-
244
-
245
-
246
-
247
-
248
-
249
-
250
-
251
-
252
-
253
-
254
-
255
-
256
-
257
-
258
-
259
-
260
-
261
-
262
-
263
-
264
-
265
-
266
-
267
-
268
 |
 |

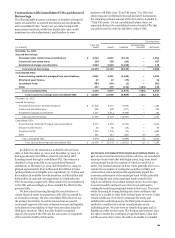
Transactions with Consolidated VIEs and Secured instances will differ from “Total VIE assets.” For VIEs that
Borrowings
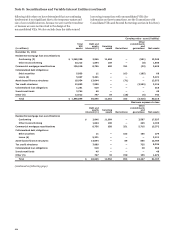
The following table presents a summary of transfers of financial
obtain exposure synthetically through derivative instruments,
the remaining notional amount of the derivative is included in
assets accounted for as secured borrowings and involvements “Total VIE assets.” On our consolidated balance sheet, we
with consolidated VIEs. “Assets” are presented using GAAP separately disclose the consolidated assets of certain VIEs that
measurement methods, which may include fair value, credit can only be used to settle the liabilities of those VIEs.
impairment or other adjustments, and therefore in some
Carrying value
(in millions) Total VIE
assets Assets Liabilities Noncontrolling
interests Net assets
December 31, 2014
Secured borrowings:
Municipal tender option bond securitizations $ 5,422 4,837 (3,143) — 1,694
Commercial real estate loans 250 250 (63) — 187
Residential mortgage securitizations 4,804 5,045 (4,926) — 119
Total secured borrowings 10,476 10,132 (8,132) — 2,000
Consolidated VIEs:
Nonconforming residential mortgage loan securitizations 5,041 4,491 (1,509) — 2,982
Structured asset finance 47 47 (23) — 24
Investment funds 904 904 (2) — 902
Other 431 375 (143) (103) 129
Total consolidated VIEs 6,423 5,817 (1,677) (103) 4,037
Total secured borrowings and consolidated VIEs $ 16,899 15,949 (9,809) (103) 6,037
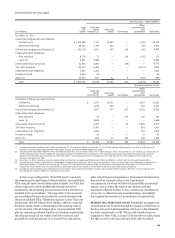
December 31, 2013
Secured borrowings:
Municipal tender option bond securitizations $ 11,626 9,210 (7,874) — 1,336
Commercial real estate loans 486 486 (277) — 209
Residential mortgage securitizations 5,337 5,611 (5,396) — 215
Total secured borrowings 17,449 15,307 (13,547) — 1,760
Consolidated VIEs:
Nonconforming residential mortgage loan securitizations 6,770 6,018 (2,214) — 3,804
Structured asset finance 56 56 (18) — 38
Investment funds 1,536 1,536 (70) — 1,466
Other 582 512 (182) (5) 325
Total consolidated VIEs 8,944 8,122 (2,484) (5) 5,633
Total secured borrowings and consolidated VIEs $ 26,393 $ 23,429 $ (16,031) $ (5) $ 7,393
In addition to the transactions included in the previous
table, at both December 31, 2014, and December 31, 2013, we
had approximately $6.0 billion of private placement debt
financing issued through a consolidated VIE. The issuance is
classified as long-term debt in our consolidated financial
statements. At December 31, 2014, and December 31, 2013, we
pledged approximately $637 million and $6.6 billion in loans
(principal and interest eligible to be capitalized), $5.7 billion and
$160 million in available-for-sale securities, and $0 million and
$180 million in cash and cash equivalents to collateralize the
VIE’s borrowings, respectively. These assets were not transferred
to the VIE, and accordingly we have excluded the VIE from the
previous table.
We have raised financing through the securitization of
certain financial assets in transactions with VIEs accounted for
as secured borrowings. We also consolidate VIEs where we are
the primary beneficiary. In certain transactions we provide
contractual support in the form of limited recourse and liquidity
to facilitate the remarketing of short-term securities issued to
third party investors. Other than this limited contractual
support, the assets of the VIEs are the sole source of repayment
of the securities held by third parties.
MUNICIPAL TENDER OPTION BOND SECURITIZATIONS As
part of our normal investment portfolio activities, we consolidate
municipal bond trusts that hold highly rated, long-term, fixed-
rate municipal bonds, the majority of which are rated AA or
better. Our residual interests in these trusts generally allow us to
capture the economics of owning the securities outright, and
constructively make decisions that significantly impact the
economic performance of the municipal bond vehicle, primarily
by directing the sale of the municipal bonds owned by the
vehicle. In addition, the residual interest owners have the right
to receive benefits and bear losses that are proportional to
owning the underlying municipal bonds in the trusts. The trusts
obtain financing by issuing floating-rate trust certificates that
reprice on a weekly or other basis to third-party investors. Under
certain conditions, if we elect to terminate the trusts and
withdraw the underlying assets, the third party investors are
entitled to a small portion of any unrealized gain on the
underlying assets. We may serve as remarketing agent and/or
liquidity provider for the trusts. The floating-rate investors have
the right to tender the certificates at specified dates, often with
as little as seven days’ notice. Should we be unable to remarket
189