Wells Fargo 2014 Annual Report Download - page 40
Download and view the complete annual report
Please find page 40 of the 2014 Wells Fargo annual report below. You can navigate through the pages in the report by either clicking on the pages listed below, or by using the keyword search tool below to find specific information within the annual report.-
 1
1 -
2
-
3
-
4
-
5
-
6
-
7
-
8
-
9
-
10
-
11
-
12
-
13
-
14
-
15
-
16
-
17
-
18
-
19
-
20
-
21
-
22
-
23
-
24
-
25
-
26
-
27
-
28
-
29
-
 30
30 -
 31
31 -
 32
32 -
 33
33 -
 34
34 -
 35
35 -
 36
36 -
 37
37 -
 38
38 -
 39
39 -
 40
40 -
 41
41 -
 42
42 -
 43
43 -
 44
44 -
 45
45 -
 46
46 -
 47
47 -
 48
48 -
 49
49 -
 50
50 -
51
-
52
-
53
-
54
-
55
-
56
-
57
-
58
-
59
-
60
-
61
-
62
-
63
-
64
-
65
-
66
-
67
-
68
-
69
-
70
-
71
-
72
-
73
-
74
-
75
-
76
-
77
-
78
-
79
-
80
-
81
-
82
-
83
-
84
-
85
-
86
-
87
-
88
-
89
-
90
-
91
-
92
-
93
-
94
-
95
-
96
-
97
-
98
-
99
-
100
-
101
-
102
-
103
-
104
-
105
-
106
-
107
-
108
-
109
-
110
-
111
-
112
-
113
-
114
-
115
-
116
-
117
-
118
-
119
-
120
-
121
-
122
-
123
-
124
-
125
-
126
-
127
-
128
-
129
-
130
-
131
-
132
-
133
-
134
-
135
-
136
-
137
-
138
-
139
-
140
-
141
-
142
-
143
-
144
-
145
-
146
-
147
-
148
-
149
-
150
-
151
-
152
-
153
-
154
-
155
-
156
-
157
-
158
-
159
-
160
-
161
-
162
-
163
-
164
-
165
-
166
-
167
-
168
-
169
-
170
-
171
-
172
-
173
-
174
-
175
-
176
-
177
-
178
-
179
-
180
-
181
-
182
-
183
-
184
-
185
-
186
-
187
-
188
-
189
-
190
-
191
-
192
-
193
-
194
-
195
-
196
-
197
-
198
-
199
-
200
-
201
-
202
-
203
-
204
-
205
-
206
-
207
-
208
-
209
-
210
-
211
-
212
-
213
-
214
-
215
-
216
-
217
-
218
-
219
-
220
-
221
-
222
-
223
-
224
-
225
-
226
-
227
-
228
-
229
-
230
-
231
-
232
-
233
-
234
-
235
-
236
-
237
-
238
-
239
-
240
-
241
-
242
-
243
-
244
-
245
-
246
-
247
-
248
-
249
-
250
-
251
-
252
-
253
-
254
-
255
-
256
-
257
-
258
-
259
-
260
-
261
-
262
-
263
-
264
-
265
-
266
-
267
-
268
 |
 |

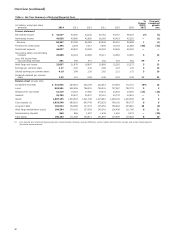
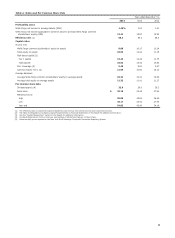
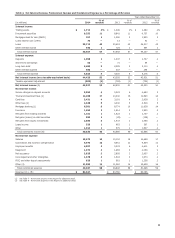
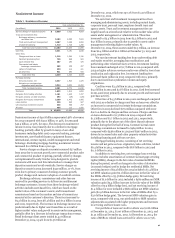
Table 5: Average Balances, Yields and Rates Paid (Taxable-Equivalent Basis) (1)(2)
2014 2013
Interest Interest
Average Yields/ income/ Average Yields/ income/
(in millions) balance rates expense balance rates expense
Earning assets
Federal funds sold, securities purchased under
resale agreements and other short-term investments $ 241,282 0.28% $ 673 154,902 0.32% $ 489
Trading assets 55,140 3.10 1,712 44,745 3.14 1,406
Investment securities (3):
Available-for-sale securities:
Securities of U.S. Treasury and federal agencies 10,400 1.64 171 6,750 1.66 112
Securities of U.S. states and political subdivisions 43,138 4.29 1,852 39,922 4.38 1,748
Mortgage-backed securities:
Federal agencies 114,076 2.84 3,235 107,148 2.83 3,031
Residential and commercial 26,475 6.03 1,597 30,717 6.47 1,988
Total mortgage-backed securities 140,551 3.44 4,832 137,865 3.64 5,019
Other debt and equity securities 47,488 3.66 1,741 55,002 3.53 1,940
Total available-for-sale securities 241,577 3.56 8,596 239,539 3.68 8,819
Held-to-maturity securities:
Securities of U.S. Treasury and federal agencies 17,239 2.23 385 — — —
Securities of U.S. states and political subdivisions 246 4.93 12 — — —
Federal agency mortgage-backed securities 5,921 2.55 151 701 3.09 22
Other debt securities 5,913 1.85 109 16 1.99 —
Held-to-maturity securities 29,319 2.24 657 717 3.06 22
Total investment securities 270,896 3.42 9,253 240,256 3.68 8,841
Mortgages held for sale (4) 19,018 4.03 767 35,273 3.66 1,290
Loans held for sale (4) 4,226 1.85 78 163 7.95 13
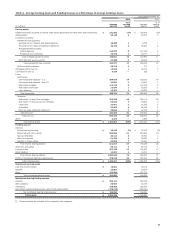
Loans:
Commercial:
Commercial and industrial - U.S. 204,819 3.35 6,869 185,813 3.66 6,807
Commercial and industrial - non U.S. 42,661 2.03 867 40,987 2.03 832
Real estate mortgage 112,710 3.64 4,100 107,316 3.94 4,233
Real estate construction 17,676 4.21 744 16,537 4.76 787
Lease financing 12,257 5.63 690 12,373 6.10 755
Total commercial 390,123 3.40 13,270 363,026 3.70 13,414
Consumer:
Real estate 1-4 family first mortgage 261,620 4.19 10,961 254,012 4.22 10,717
Real estate 1-4 family junior lien mortgage 62,510 4.30 2,686 70,264 4.29 3,014
Credit card 27,491 11.98 3,294 24,757 12.46 3,084
Automobile 53,854 6.27 3,377 48,476 6.94 3,365
Other revolving credit and installment 38,834 5.48 2,127 42,135 4.80 2,024
Total consumer 444,309 5.05 22,445 439,644 5.05 22,204
Total loans (4) 834,432 4.28 35,715 802,670 4.44 35,618
Other 4,673 5.54 259 4,354 5.39 235
Total earning assets $ 1,429,667 3.39% $ 48,457 1,282,363 3.73% $ 47,892
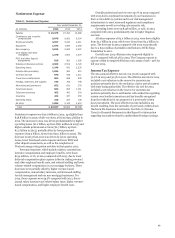
Funding sources
Deposits:
Interest-bearing checking $ 39,729 0.07% $ 26 35,570 0.06% $ 22
Market rate and other savings 585,854 0.07 403 550,394 0.08 450
Savings certificates 38,111 0.85 323 49,510 1.13 559
Other time deposits 51,434 0.40 207 28,090 0.69 194
Deposits in foreign offices 95,889 0.14 137 76,894 0.15 112
Total interest-bearing deposits 811,017 0.14 1,096 740,458 0.18 1,337
Short-term borrowings 60,111 0.10 62 54,716 0.13 71
Long-term debt 167,420 1.49 2,488 134,937 1.92 2,585
Other liabilities 14,401 2.65 382 12,471 2.46 307
Total interest-bearing liabilities 1,052,949 0.38 4,028 942,582 0.46 4,300
Portion of noninterest-bearing funding sources 376,718 — — 339,781 — —
Total funding sources $ 1,429,667 0.28 4,028 1,282,363 0.33 4,300
Net interest margin and net interest income on a taxable-
equivalent basis (5) 3.11% $ 44,429 3.40% $ 43,592
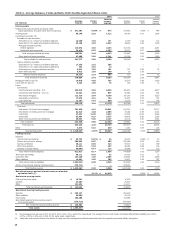
Noninterest-earning assets
Cash and due from banks $ 16,361 16,272
Goodwill 25,687 25,637
Other 121,634 121,711
Total noninterest-earning assets $ 163,682 163,620
Noninterest-bearing funding sources
Deposits $ 303,127 280,229
Other liabilities 56,985 58,178
Total equity 180,288 164,994
Noninterest-bearing funding sources used to
fund earning assets (376,718) (339,781)
Net noninterest-bearing funding sources $ 163,682 163,620
Total assets $ 1,593,349 1,445,983
(1) Our average prime rate was 3.25% for 2014, 2013, 2012, 2011, and 2010, respectively. The average three-month London Interbank Offered Rate (LIBOR) was 0.23%,
0.27%, 0.43%, 0.34%, and 0.34% for the same years, respectively.
(2) Yield/rates and amounts include the effects of hedge and risk management activities associated with the respective asset and liability categories.
38