Wells Fargo 2014 Annual Report Download - page 70
Download and view the complete annual report
Please find page 70 of the 2014 Wells Fargo annual report below. You can navigate through the pages in the report by either clicking on the pages listed below, or by using the keyword search tool below to find specific information within the annual report.-
 1
1 -
2
-
3
-
4
-
5
-
6
-
7
-
8
-
9
-
10
-
11
-
12
-
13
-
14
-
15
-
16
-
17
-
18
-
19
-
20
-
21
-
22
-
23
-
24
-
25
-
26
-
27
-
28
-
29
-
30
-
31
-
32
-
33
-
34
-
35
-
36
-
37
-
38
-
39
-
40
-
41
-
42
-
43
-
44
-
45
-
46
-
47
-
48
-
49
-
50
-
51
-
52
-
53
-
54
-
55
-
56
-
57
-
58
-
59
-
 60
60 -
 61
61 -
 62
62 -
 63
63 -
 64
64 -
 65
65 -
 66
66 -
 67
67 -
 68
68 -
 69
69 -
 70
70 -
 71
71 -
 72
72 -
 73
73 -
 74
74 -
 75
75 -
 76
76 -
 77
77 -
 78
78 -
 79
79 -
 80
80 -
81
-
82
-
83
-
84
-
85
-
86
-
87
-
88
-
89
-
90
-
91
-
92
-
93
-
94
-
95
-
96
-
97
-
98
-
99
-
100
-
101
-
102
-
103
-
104
-
105
-
106
-
107
-
108
-
109
-
110
-
111
-
112
-
113
-
114
-
115
-
116
-
117
-
118
-
119
-
120
-
121
-
122
-
123
-
124
-
125
-
126
-
127
-
128
-
129
-
130
-
131
-
132
-
133
-
134
-
135
-
136
-
137
-
138
-
139
-
140
-
141
-
142
-
143
-
144
-
145
-
146
-
147
-
148
-
149
-
150
-
151
-
152
-
153
-
154
-
155
-
156
-
157
-
158
-
159
-
160
-
161
-
162
-
163
-
164
-
165
-
166
-
167
-
168
-
169
-
170
-
171
-
172
-
173
-
174
-
175
-
176
-
177
-
178
-
179
-
180
-
181
-
182
-
183
-
184
-
185
-
186
-
187
-
188
-
189
-
190
-
191
-
192
-
193
-
194
-
195
-
196
-
197
-
198
-
199
-
200
-
201
-
202
-
203
-
204
-
205
-
206
-
207
-
208
-
209
-
210
-
211
-
212
-
213
-
214
-
215
-
216
-
217
-
218
-
219
-
220
-
221
-
222
-
223
-
224
-
225
-
226
-
227
-
228
-
229
-
230
-
231
-
232
-
233
-
234
-
235
-
236
-
237
-
238
-
239
-
240
-
241
-
242
-
243
-
244
-
245
-
246
-
247
-
248
-
249
-
250
-
251
-
252
-
253
-
254
-
255
-
256
-
257
-
258
-
259
-
260
-
261
-
262
-
263
-
264
-
265
-
266
-
267
-
268
 |
 |

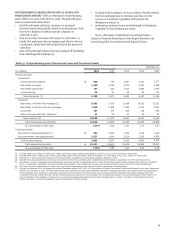
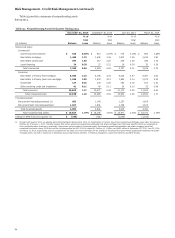
Risk Management - Credit Risk Management (continued)
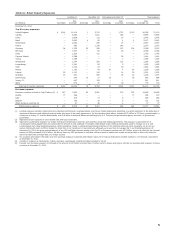
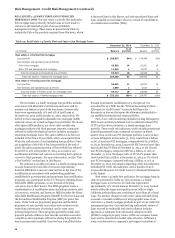
First Lien Mortgage Portfolio The credit performance
associated with our real estate 1-4 family first lien mortgage
portfolio continued to improve in 2014, as measured through net
charge-offs and nonaccrual loans. Net charge-offs as a
percentage of average total loans improved to 0.19% in 2014,
compared with 0.47% in 2013. Nonaccrual loans were
$8.6 billion at December 31, 2014, compared with $9.8 billion at
December 31, 2013. Improvement in the credit performance was
driven by both an improving economic and housing environment
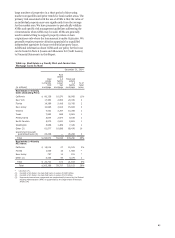
Table 25: First Lien Mortgage Portfolios Performance (1)
and declining balances in non-strategic and liquidating loans,
which have been replaced with higher quality assets originated
after 2008 utilizing tighter underwriting standards. Real estate
1-4 family first lien mortgage loans originated after 2008 have
resulted in minimal losses to date and were approximately 60%
of our total real estate 1-4 family first lien mortgage portfolio as
of December 31, 2014. First lien mortgage portfolios by state are
presented in Table 25.
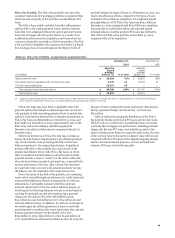
Outstanding balance % of loans two payments
or more past due Loss rate
(in millions)
Dec 31,
2014
Dec 31,
2013
Dec 31,
2014
Dec 31,
2013
Year ended December 31,
2014 2013
Core portfolio:
California
New York
Florida
New Jersey
Texas
Other
$ 67,038
16,102
10,991
9,203
6,646
72,604
56,511
13,030
11,113
8,091
6,200
68,817
0.83%
1.97
3.78
3.95
1.48
2.34
1.15
2.73
4.97
5.17
1.86
2.97
0.02
0.09
0.12
0.30
0.01
0.18
0.11
0.17
0.87
0.71
0.09
0.49
Total
Government insured/guaranteed loans
Total core portfolio including government insured/
guaranteed loans
Liquidating portfolio
Total first lien mortgages $
182,584
26,268
208,852
34,822
243,674
163,762
30,737
194,499
39,908
234,407
1.89
1.89
15.55
4.08%
2.53
2.53
15.86
5.14
0.11
0.11
0.84
0.24
0.36
0.36
1.46
0.60
(1) Excludes PCI loans because their losses were generally reflected in PCI accounting adjustments at the date of acquisition.
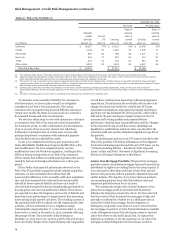
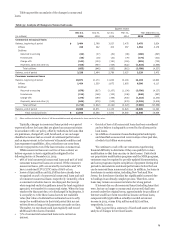
In 2014, we continued to grow our real estate 1-4 family first
lien mortgage portfolio through the retention of high-quality
non-conforming mortgages. Substantially all non-conforming
loans originated in 2014 were classified as non-conforming due
to the loan amount exceeding conventional conforming loan
amount limits established by federal government-sponsored
entities (GSEs). Our total real estate 1-4 family first lien
mortgage portfolio increased $6.9 billion in 2014. The growth in
this portfolio has been largely offset by runoff in our real estate
1-4 family first lien mortgage non-strategic and liquidating
portfolios. Excluding this runoff, our core real estate 1-4 family
first lien mortgage portfolio increased $14.4 billion, as we
retained $42.3 billion in non-conforming originations, primarily
consisting of loans that exceed GSE lending limits, in 2014.
68