Wells Fargo 2014 Annual Report Download - page 211
Download and view the complete annual report
Please find page 211 of the 2014 Wells Fargo annual report below. You can navigate through the pages in the report by either clicking on the pages listed below, or by using the keyword search tool below to find specific information within the annual report.-
 1
1 -
2
-
3
-
4
-
5
-
6
-
7
-
8
-
9
-
10
-
11
-
12
-
13
-
14
-
15
-
16
-
17
-
18
-
19
-
20
-
21
-
22
-
23
-
24
-
25
-
26
-
27
-
28
-
29
-
30
-
31
-
32
-
33
-
34
-
35
-
36
-
37
-
38
-
39
-
40
-
41
-
42
-
43
-
44
-
45
-
46
-
47
-
48
-
49
-
50
-
51
-
52
-
53
-
54
-
55
-
56
-
57
-
58
-
59
-
60
-
61
-
62
-
63
-
64
-
65
-
66
-
67
-
68
-
69
-
70
-
71
-
72
-
73
-
74
-
75
-
76
-
77
-
78
-
79
-
80
-
81
-
82
-
83
-
84
-
85
-
86
-
87
-
88
-
89
-
90
-
91
-
92
-
93
-
94
-
95
-
96
-
97
-
98
-
99
-
100
-
101
-
102
-
103
-
104
-
105
-
106
-
107
-
108
-
109
-
110
-
111
-
112
-
113
-
114
-
115
-
116
-
117
-
118
-
119
-
120
-
121
-
122
-
123
-
124
-
125
-
126
-
127
-
128
-
129
-
130
-
131
-
132
-
133
-
134
-
135
-
136
-
137
-
138
-
139
-
140
-
141
-
142
-
143
-
144
-
145
-
146
-
147
-
148
-
149
-
150
-
151
-
152
-
153
-
154
-
155
-
156
-
157
-
158
-
159
-
160
-
161
-
162
-
163
-
164
-
165
-
166
-
167
-
168
-
169
-
170
-
171
-
172
-
173
-
174
-
175
-
176
-
177
-
178
-
179
-
180
-
181
-
182
-
183
-
184
-
185
-
186
-
187
-
188
-
189
-
190
-
191
-
192
-
193
-
194
-
195
-
196
-
197
-
198
-
199
-
200
-
 201
201 -
 202
202 -
 203
203 -
 204
204 -
 205
205 -
 206
206 -
 207
207 -
 208
208 -
 209
209 -
 210
210 -
 211
211 -
 212
212 -
 213
213 -
 214
214 -
 215
215 -
 216
216 -
 217
217 -
 218
218 -
 219
219 -
 220
220 -
 221
221 -
222
-
223
-
224
-
225
-
226
-
227
-
228
-
229
-
230
-
231
-
232
-
233
-
234
-
235
-
236
-
237
-
238
-
239
-
240
-
241
-
242
-
243
-
244
-
245
-
246
-
247
-
248
-
249
-
250
-
251
-
252
-
253
-
254
-
255
-
256
-
257
-
258
-
259
-
260
-
261
-
262
-
263
-
264
-
265
-
266
-
267
-
268
 |
 |

Cash Flow Hedges
We use interest rate swaps to hedge the variability in interest
payments received on certain floating-rate commercial loans and
paid on certain floating-rate debt due to changes in the
benchmark interest rate. Gains and losses on derivatives that are
reclassified from OCI to interest income (for loans) and interest
expense (for debt) in the current period are included in the line
item in which the hedged item’s effect on earnings is recorded.
All parts of gain or loss on these derivatives are included in the
assessment of hedge effectiveness. We assess hedge effectiveness
using regression analysis, both at inception of the hedging
relationship and on an ongoing basis. The regression analysis
involves regressing the periodic changes in cash flows of the
hedging instrument against the periodic changes in cash flows of
the forecasted transaction being hedged due to changes in the
hedged risk(s). The assessment includes an evaluation of the
quantitative measures of the regression results used to validate
the conclusion of high effectiveness.
Based upon current interest rates, we estimate that
$758 million (pre tax) of deferred net gains on derivatives in OCI
at December 31, 2014, will be reclassified into net interest
income during the next twelve months. Future changes to
interest rates may significantly change actual amounts
reclassified to earnings. We are hedging our exposure to the
variability of future cash flows for all forecasted transactions for
a maximum of 7 years.
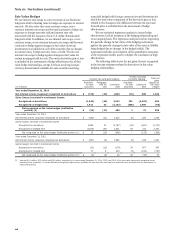
The following table shows the net gains (losses) recognized
related to derivatives in cash flow hedging relationships.
Year ended December 31,
(in millions) 2014 2013 2012
Gains (losses) (pre tax) recognized in OCI on derivatives
Gains (pre tax) reclassified from cumulative OCI into net income (1)
Gains (losses) (pre tax) recognized in noninterest income for hedge ineffectiveness (2)
$ 952
545
2
(32)
296
1
52
388
(1)
(1) See Note 23 (Other Comprehensive Income) for detail on components of net income.
(2) None of the change in value of the derivatives was excluded from the assessment of hedge effectiveness.
Derivatives Not Designated as Hedging Instruments
We use economic hedge derivatives primarily to hedge the risk of
changes in the fair value of certain residential MHFS, certain
loans held for investment, residential MSRs measured at fair
value, derivative loan commitments and other interests held.
The resulting gain or loss on these economic hedge derivatives is
reflected in mortgage banking noninterest income, net gains
(losses) from equity investments and other noninterest income.
The derivatives used to hedge MSRs measured at fair value,
which include swaps, swaptions, constant maturity mortgages,
forwards, Eurodollar and Treasury futures and options
contracts, resulted in net derivative gains of $3.5 billion in 2014,
net derivative losses of $2.9 billion in 2013 and net derivative
gains of $3.6 billion in 2012, which are included in mortgage
banking noninterest income. The aggregate fair value of these
derivatives was a net asset of $492 million at December 31, 2014
and a net liability of $531 million at December 31, 2013. The
change in fair value of these derivatives for each period end is
due to changes in the underlying market indices and interest
rates as well as the purchase and sale of derivative financial
instruments throughout the period as part of our dynamic MSR
risk management process.
Interest rate lock commitments for mortgage loans that we
intend to sell are considered derivatives. Our interest rate
exposure on these derivative loan commitments, as well as
substantially all residential MHFS, is hedged with economic
hedge derivatives such as swaps, forwards and options,
Eurodollar futures and options, and Treasury futures, forwards
and options contracts. The derivative loan commitments,
economic hedge derivatives and residential MHFS are carried at
fair value with changes in fair value included in mortgage
banking noninterest income. For the fair value measurement of
interest rate lock commitments we include, at inception and
during the life of the loan commitment, the expected net future
cash flows related to the associated servicing of the loan. Fair
value changes subsequent to inception are based on changes in
fair value of the underlying loan resulting from the exercise of
the commitment and changes in the probability that the loan will
not fund within the terms of the commitment (referred to as a
fall-out factor). The value of the underlying loan is affected
primarily by changes in interest rates and the passage of time.
However, changes in investor demand can also cause changes in
the value of the underlying loan value that cannot be hedged.
The aggregate fair value of derivative loan commitments on the
balance sheet was a net asset of $98 million and a net liability of
$26 million at December 31, 2014 and December 31, 2013,
respectively, and is included in the caption “Interest rate
contracts” under “Customer accommodation, trading and other
derivatives” in the first table in this Note.
We also enter into various derivatives primarily to provide
derivative products to customers. These derivatives are not
linked to specific assets and liabilities on the balance sheet or to
forecasted transactions in an accounting hedge relationship and,
therefore, do not qualify for hedge accounting. We also enter
into derivatives for risk management that do not otherwise
qualify for hedge accounting. They are carried at fair value with
changes in fair value recorded as other noninterest income.
Customer accommodation, trading and other derivatives
also include embedded derivatives that are required to be
accounted for separately from their host contract. We
periodically issue hybrid long-term notes and CDs where the
performance of the hybrid instrument notes is linked to an
equity, commodity or currency index, or basket of such indices.
These notes contain explicit terms that affect some or all of the
cash flows or the value of the note in a manner similar to a
derivative instrument and therefore are considered to contain an
“embedded” derivative instrument. The indices on which the
performance of the hybrid instrument is calculated are not
clearly and closely related to the host debt instrument. The
“embedded” derivative is separated from the host contract and
accounted for as a derivative. Additionally, we may invest in
hybrid instruments that contain embedded derivatives, such as
credit derivatives, that are not clearly and closely related to the
host contract. In such instances, we either elect fair value option
for the hybrid instrument or separate the embedded derivative
from the host contract and account for the host contract and
derivative separately.
209