Wells Fargo 2014 Annual Report Download - page 160
Download and view the complete annual report
Please find page 160 of the 2014 Wells Fargo annual report below. You can navigate through the pages in the report by either clicking on the pages listed below, or by using the keyword search tool below to find specific information within the annual report.-
 1
1 -
2
-
3
-
4
-
5
-
6
-
7
-
8
-
9
-
10
-
11
-
12
-
13
-
14
-
15
-
16
-
17
-
18
-
19
-
20
-
21
-
22
-
23
-
24
-
25
-
26
-
27
-
28
-
29
-
30
-
31
-
32
-
33
-
34
-
35
-
36
-
37
-
38
-
39
-
40
-
41
-
42
-
43
-
44
-
45
-
46
-
47
-
48
-
49
-
50
-
51
-
52
-
53
-
54
-
55
-
56
-
57
-
58
-
59
-
60
-
61
-
62
-
63
-
64
-
65
-
66
-
67
-
68
-
69
-
70
-
71
-
72
-
73
-
74
-
75
-
76
-
77
-
78
-
79
-
80
-
81
-
82
-
83
-
84
-
85
-
86
-
87
-
88
-
89
-
90
-
91
-
92
-
93
-
94
-
95
-
96
-
97
-
98
-
99
-
100
-
101
-
102
-
103
-
104
-
105
-
106
-
107
-
108
-
109
-
110
-
111
-
112
-
113
-
114
-
115
-
116
-
117
-
118
-
119
-
120
-
121
-
122
-
123
-
124
-
125
-
126
-
127
-
128
-
129
-
130
-
131
-
132
-
133
-
134
-
135
-
136
-
137
-
138
-
139
-
140
-
141
-
142
-
143
-
144
-
145
-
146
-
147
-
148
-
149
-
 150
150 -
 151
151 -
 152
152 -
 153
153 -
 154
154 -
 155
155 -
 156
156 -
 157
157 -
 158
158 -
 159
159 -
 160
160 -
 161
161 -
 162
162 -
 163
163 -
 164
164 -
 165
165 -
 166
166 -
 167
167 -
 168
168 -
 169
169 -
 170
170 -
171
-
172
-
173
-
174
-
175
-
176
-
177
-
178
-
179
-
180
-
181
-
182
-
183
-
184
-
185
-
186
-
187
-
188
-
189
-
190
-
191
-
192
-
193
-
194
-
195
-
196
-
197
-
198
-
199
-
200
-
201
-
202
-
203
-
204
-
205
-
206
-
207
-
208
-
209
-
210
-
211
-
212
-
213
-
214
-
215
-
216
-
217
-
218
-
219
-
220
-
221
-
222
-
223
-
224
-
225
-
226
-
227
-
228
-
229
-
230
-
231
-
232
-
233
-
234
-
235
-
236
-
237
-
238
-
239
-
240
-
241
-
242
-
243
-
244
-
245
-
246
-
247
-
248
-
249
-
250
-
251
-
252
-
253
-
254
-
255
-
256
-
257
-
258
-
259
-
260
-
261
-
262
-
263
-
264
-
265
-
266
-
267
-
268
 |
 |

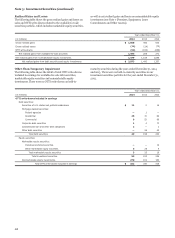
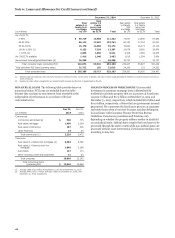
Note 5: Investment Securities (continued)
Realized Gains and Losses as well as net realized gains and losses on nonmarketable equity
The following table shows the gross realized gains and losses on investments (see Note 7 (Premises, Equipment, Lease
sales and OTTI write-downs related to the available-for-sale Commitments and Other Assets)).
securities portfolio, which includes marketable equity securities,
Year ended December 31,
(in millions) 2014 2013 2012
Gross realized gains $ 1,560 492 600
Gross realized losses (14) (24) (73)
OTTI write-downs (52) (183) (256)
Net realized gains from available-for-sale securities 1,494 285 271
Net realized gains from nonmarketable equity investments 1,479 1,158 1,086
Net realized gains from debt securities and equity investments $ 2,973 1,443 1,357
Other-Than-Temporary Impairment maturity securities during the years ended December 31, 2014
The following table shows the detail of total OTTI write-downs and 2013. There were no held-to-maturity securities in our
included in earnings for available-for-sale debt securities, investment securities portfolio for the year ended December 31,
marketable equity securities and nonmarketable equity 2012.
investments. There were no OTTI write-downs on held-to-
Year ended December 31,
(in millions) 2014 2013 2012
OTTI write-downs included in earnings
Debt securities:
Securities of U.S. states and political subdivisions $ 11 2 16
Mortgage-backed securities:
Federal agencies — 1 —
Residential 26 72 84
Commercial 9 53 86
Corporate debt securities 1 4 11
Collateralized loan and other debt obligations 2 — 1
Other debt securities — 26 42
Total debt securities 49 158 240
Equity securities:
Marketable equity securities:
Perpetual preferred securities — — 12
Other marketable equity securities 3 25 4
Total marketable equity securities 3 25
Total investment securities 52 183 256
Nonmarketable equity investments 270 161 160
Total OTTI write-downs included in earnings $ 322 344 416
16
158