Wells Fargo 2014 Annual Report Download - page 135
Download and view the complete annual report
Please find page 135 of the 2014 Wells Fargo annual report below. You can navigate through the pages in the report by either clicking on the pages listed below, or by using the keyword search tool below to find specific information within the annual report.-
 1
1 -
2
-
3
-
4
-
5
-
6
-
7
-
8
-
9
-
10
-
11
-
12
-
13
-
14
-
15
-
16
-
17
-
18
-
19
-
20
-
21
-
22
-
23
-
24
-
25
-
26
-
27
-
28
-
29
-
30
-
31
-
32
-
33
-
34
-
35
-
36
-
37
-
38
-
39
-
40
-
41
-
42
-
43
-
44
-
45
-
46
-
47
-
48
-
49
-
50
-
51
-
52
-
53
-
54
-
55
-
56
-
57
-
58
-
59
-
60
-
61
-
62
-
63
-
64
-
65
-
66
-
67
-
68
-
69
-
70
-
71
-
72
-
73
-
74
-
75
-
76
-
77
-
78
-
79
-
80
-
81
-
82
-
83
-
84
-
85
-
86
-
87
-
88
-
89
-
90
-
91
-
92
-
93
-
94
-
95
-
96
-
97
-
98
-
99
-
100
-
101
-
102
-
103
-
104
-
105
-
106
-
107
-
108
-
109
-
110
-
111
-
112
-
113
-
114
-
115
-
116
-
117
-
118
-
119
-
120
-
121
-
122
-
123
-
124
-
 125
125 -
 126
126 -
 127
127 -
 128
128 -
 129
129 -
 130
130 -
 131
131 -
 132
132 -
 133
133 -
 134
134 -
 135
135 -
 136
136 -
 137
137 -
 138
138 -
 139
139 -
 140
140 -
 141
141 -
 142
142 -
 143
143 -
 144
144 -
 145
145 -
146
-
147
-
148
-
149
-
150
-
151
-
152
-
153
-
154
-
155
-
156
-
157
-
158
-
159
-
160
-
161
-
162
-
163
-
164
-
165
-
166
-
167
-
168
-
169
-
170
-
171
-
172
-
173
-
174
-
175
-
176
-
177
-
178
-
179
-
180
-
181
-
182
-
183
-
184
-
185
-
186
-
187
-
188
-
189
-
190
-
191
-
192
-
193
-
194
-
195
-
196
-
197
-
198
-
199
-
200
-
201
-
202
-
203
-
204
-
205
-
206
-
207
-
208
-
209
-
210
-
211
-
212
-
213
-
214
-
215
-
216
-
217
-
218
-
219
-
220
-
221
-
222
-
223
-
224
-
225
-
226
-
227
-
228
-
229
-
230
-
231
-
232
-
233
-
234
-
235
-
236
-
237
-
238
-
239
-
240
-
241
-
242
-
243
-
244
-
245
-
246
-
247
-
248
-
249
-
250
-
251
-
252
-
253
-
254
-
255
-
256
-
257
-
258
-
259
-
260
-
261
-
262
-
263
-
264
-
265
-
266
-
267
-
268
 |
 |

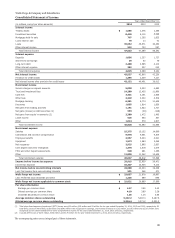
Wells Fargo & Company and Subsidiaries
Consolidated Balance Sheet
Dec 31, Dec 31,
(in millions, except shares) 2014 2013
Assets
Cash and due from banks $ 19,571 19,919
Federal funds sold, securities purchased under resale agreements and other short-term investments 258,429 213,793
Trading assets 78,255 62,813
Investment securities:
Available-for-sale, at fair value 257,442 252,007
Held-to-maturity, at cost (fair value $56,359 and $12,247) 55,483 12,346
Mortgages held for sale (includes $15,565 and $13,879 carried at fair value) (1) 19,536 16,763
Loans held for sale (includes $1 and $1 carried at fair value) (1) 722 133
Loans (includes $5,788 and $5,995 carried at fair value) (1)(2) 862,551 822,286
Allowance for loan losses (12,319) (14,502)
Net loans (2) 850,232 807,784
Mortgage servicing rights:
Measured at fair value 12,738 15,580
Amortized 1,242 1,229
Premises and equipment, net 8,743 9,156
Goodwill 25,705 25,637
Other assets (includes $2,512 and $1,386 carried at fair value) (1) 99,057 86,342
Total assets (2)(3) $ 1,687,155 1,523,502
Liabilities
Noninterest-bearing deposits $ 321,963 288,117
Interest-bearing deposits 846,347 791,060
Total deposits 1,168,310 1,079,177
Short-term borrowings 63,518 53,883
Accrued expenses and other liabilities (2) 86,122 66,436
Long-term debt 183,943 152,998
Total liabilities (2)(4) 1,501,893 1,352,494
Equity
Wells Fargo stockholders' equity:
Preferred stock 19,213 16,267
Common stock – $1-2/3 par value, authorized 9,000,000,000 shares; issued 5,481,811,474 shares and
5,481,811,474 shares 9,136 9,136
Additional paid-in capital 60,537 60,296
Retained earnings 107,040 92,361
Cumulative other comprehensive income 3,518 1,386
Treasury stock – 311,462,276 shares and 224,648,769 shares (13,690) (8,104)
Unearned ESOP shares (1,360) (1,200)
Total Wells Fargo stockholders' equity 184,394 170,142
Noncontrolling interests 868 866
Total equity 185,262 171,008
Total liabilities and equity (2) $ 1,687,155 1,523,502
(1) Parenthetical amounts represent assets and liabilities for which we have elected the fair value option.
(2) Financial information for certain periods prior to 2014 was revised to reflect our determination that certain factoring arrangements did not qualify as loans. See Note 1
(Summary of Significant Accounting Policies) for more information.
(3) Our consolidated assets at December 31, 2014 and December 31, 2013, include the following assets of certain variable interest entities (VIEs) that can only be used to
settle the liabilities of those VIEs: Cash and due from banks, $117 million and $165 million; Trading assets, $0 million and $162 million; Investment securities, $875 million
and $1.4 billion; Mortgages held for sale, $0 million and $38 million; Net loans, $4.5 billion and $6.1 billion; Other assets, $316 million and $347 million, and Total assets,
$5.8 billion and $8.1 billion, respectively.
(4) Our consolidated liabilities at December 31, 2014 and December 31, 2013, include the following VIE liabilities for which the VIE creditors do not have recourse to
Wells Fargo: Short-term borrowings, $0 million and $29 million; Accrued expenses and other liabilities, $49 million and $90 million; Long-term debt, $1.6 billion and
$2.3 billion; and Total liabilities, $1.7 billion and $2.4 billion, respectively.
The accompanying notes are an integral part of these statements.
133