Wells Fargo 2014 Annual Report Download - page 86
Download and view the complete annual report
Please find page 86 of the 2014 Wells Fargo annual report below. You can navigate through the pages in the report by either clicking on the pages listed below, or by using the keyword search tool below to find specific information within the annual report.-
 1
1 -
2
-
3
-
4
-
5
-
6
-
7
-
8
-
9
-
10
-
11
-
12
-
13
-
14
-
15
-
16
-
17
-
18
-
19
-
20
-
21
-
22
-
23
-
24
-
25
-
26
-
27
-
28
-
29
-
30
-
31
-
32
-
33
-
34
-
35
-
36
-
37
-
38
-
39
-
40
-
41
-
42
-
43
-
44
-
45
-
46
-
47
-
48
-
49
-
50
-
51
-
52
-
53
-
54
-
55
-
56
-
57
-
58
-
59
-
60
-
61
-
62
-
63
-
64
-
65
-
66
-
67
-
68
-
69
-
70
-
71
-
72
-
73
-
74
-
75
-
 76
76 -
 77
77 -
 78
78 -
 79
79 -
 80
80 -
 81
81 -
 82
82 -
 83
83 -
 84
84 -
 85
85 -
 86
86 -
 87
87 -
 88
88 -
 89
89 -
 90
90 -
 91
91 -
 92
92 -
 93
93 -
 94
94 -
 95
95 -
 96
96 -
97
-
98
-
99
-
100
-
101
-
102
-
103
-
104
-
105
-
106
-
107
-
108
-
109
-
110
-
111
-
112
-
113
-
114
-
115
-
116
-
117
-
118
-
119
-
120
-
121
-
122
-
123
-
124
-
125
-
126
-
127
-
128
-
129
-
130
-
131
-
132
-
133
-
134
-
135
-
136
-
137
-
138
-
139
-
140
-
141
-
142
-
143
-
144
-
145
-
146
-
147
-
148
-
149
-
150
-
151
-
152
-
153
-
154
-
155
-
156
-
157
-
158
-
159
-
160
-
161
-
162
-
163
-
164
-
165
-
166
-
167
-
168
-
169
-
170
-
171
-
172
-
173
-
174
-
175
-
176
-
177
-
178
-
179
-
180
-
181
-
182
-
183
-
184
-
185
-
186
-
187
-
188
-
189
-
190
-
191
-
192
-
193
-
194
-
195
-
196
-
197
-
198
-
199
-
200
-
201
-
202
-
203
-
204
-
205
-
206
-
207
-
208
-
209
-
210
-
211
-
212
-
213
-
214
-
215
-
216
-
217
-
218
-
219
-
220
-
221
-
222
-
223
-
224
-
225
-
226
-
227
-
228
-
229
-
230
-
231
-
232
-
233
-
234
-
235
-
236
-
237
-
238
-
239
-
240
-
241
-
242
-
243
-
244
-
245
-
246
-
247
-
248
-
249
-
250
-
251
-
252
-
253
-
254
-
255
-
256
-
257
-
258
-
259
-
260
-
261
-
262
-
263
-
264
-
265
-
266
-
267
-
268
 |
 |

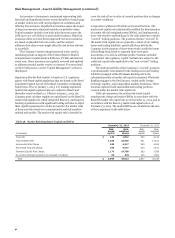
Risk Management - Credit Risk Management (continued)
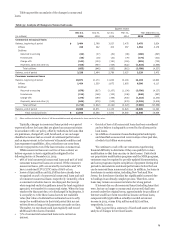
Table 41: Unresolved Repurchase Demands and Mortgage Insurance Rescissions
Government Mortgage insurance
rescissions with no demand
sponsored entities (1) Private (2) Total
($ in millions) Number of
loans Original loan
balance (3) Number of
loans Original loan
balance (3) Number of
loans Original loan
balance (3) Number of
loans Original loan
balance (3)
2014
December 31, 546 $ 118 173 $ 34 120 $ 31 839 $ 183
September 30, 426 93 322 75 233 52 981 220
June 30, 678 149 362 80 305 66 1,345 295
March 31, 599 126 391 89 409 90 1,399 305
2013
December 31, 674 124 2,260 497 394 87 3,328 708
September 30, 4,422 958 1,240 264 385 87 6,047 1,309
June 30, 6,313 1,413 1,206 258 561 127 8,080 1,798
March 31, 5,910 1,371 1,278 278 652 145 7,840 1,794
(1) Includes unresolved repurchase demands of 4 and $1 million, 7 and $1 million, 14 and $3 million, 25 and $3 million, 42 and $6 million, 1,247 and $225 million, 942 and
$190 million and 674 and $147 million at December 31, September 30, June 30 and March 31, 2014, and December 31, September 30, June 30 and March 31, 2013,
respectively, received from investors on mortgage servicing rights acquired from other originators. We generally have the right of recourse against the seller and may be
able to recover losses related to such repurchase demands subject to counterparty risk associated with the seller.
(2) As part of our representations and warranties in our loan sales contracts, we typically represent to GSEs and private investors that certain loans have mortgage insurance
to the extent there are loans that have loan to value ratios in excess of 80% that require mortgage insurance. To the extent the mortgage insurance is rescinded by the
mortgage insurer due to a claim of breach of a contractual representation or warranty, the lack of insurance may result in a repurchase demand from an investor. Similar to
repurchase demands, we evaluate mortgage insurance rescission notices for validity and appeal for reinstatement if the rescission was not based on a contractual breach.
When investor demands are received due to lack of mortgage insurance, they are reported as unresolved repurchase demands based on the applicable investor category
for the loan (GSE or private).
(3) While the original loan balances related to these demands are presented above, the establishment of the repurchase liability is based on a combination of factors, such as
our appeals success rates, reimbursement by correspondent and other third party originators, and projected loss severity, which is driven by the difference between the
current loan balance and the estimated collateral value less costs to sell the property.
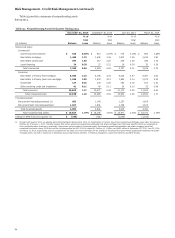
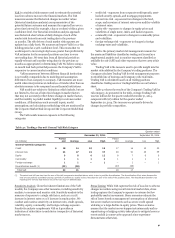
Table 42 summarizes the changes in our mortgage $746 million and the $508 million cash payments for the
repurchase liability. We incurred net losses on repurchased FHLMC and FNMA settlement agreements, respectively.
loans and investor reimbursements totaling $144 million in
2014, compared with $481 million in 2013, excluding the
Table 42: Changes in Mortgage Repurchase Liability
Quarter ended
Dec 31, Sep 30, Jun 30, Mar 31, Year ended Dec. 31,
(in millions) 2014 2014 2014 2014 2014 2013 2012
Balance, beginning of period $ 669 766 799 899 899 2,206 1,326
Provision for repurchase losses:
Loan sales 10 12 12 10 44 143 275
Change in estimate (1) (49) (93) (38) (4) (184) 285 1,665
Total additions (reductions) (39) (81) (26) 6 (140) 428 1,940
Losses (2) (15) (16) (7) (106) (144) (1,735) (1,060)
Balance, end of period $ 615 669 766 799 615 899 2,206
(1) Results from changes in investor demand and mortgage insurer practices, credit deterioration and changes in the financial stability of correspondent lenders.
(2) Year ended December 31, 2013, reflects $746 million as a result of the agreement with FHLMC that resolves substantially all repurchase liabilities related to loans sold to
FHLMC prior to January 1, 2009. Year ended December 31, 2013, reflects $508 million as a result of the agreement with FNMA that resolves substantially all repurchase
liabilities related to loans sold to FNMA that were originated prior to January 1, 2009.
Our liability for mortgage repurchases, included in “Accrued
expenses and other liabilities” in our consolidated balance sheet,
represents our best estimate of the probable loss that we expect
to incur for various representations and warranties in the
contractual provisions of our sales of mortgage loans. The
mortgage repurchase liability estimation process requires
management to make difficult, subjective and complex
judgments about matters that are inherently uncertain,
including demand expectations, economic factors, and the
specific characteristics of the loans subject to repurchase. Our
evaluation considers all vintages and the collective actions of the
GSEs and their regulator, the Federal Housing Finance Agency
(FHFA), mortgage insurers and our correspondent lenders. We
maintain regular contact with the GSEs, the FHFA, and other
significant investors to monitor their repurchase demand
practices and issues as part of our process to update our
repurchase liability estimate as new information becomes
available. The liability was $615 million at December 31, 2014,
and $899 million at December 31, 2013. In 2014, we released
$140 million, which increased net gains on mortgage loan
origination/sales activities, compared with a provision of
$428 million in 2013. The release in 2014 was primarily due to a
re-estimation of our liability based on recently observed trends.
Because of the uncertainty in the various estimates
underlying the mortgage repurchase liability, there is a range of
losses in excess of the recorded mortgage repurchase liability
that are reasonably possible. The estimate of the range of
possible loss for representations and warranties does not
84