Wells Fargo 2014 Annual Report Download - page 33
Download and view the complete annual report
Please find page 33 of the 2014 Wells Fargo annual report below. You can navigate through the pages in the report by either clicking on the pages listed below, or by using the keyword search tool below to find specific information within the annual report.-
 1
1 -
2
-
3
-
4
-
5
-
6
-
7
-
8
-
9
-
10
-
11
-
12
-
13
-
14
-
15
-
16
-
17
-
18
-
19
-
20
-
21
-
22
-
 23
23 -
 24
24 -
 25
25 -
 26
26 -
 27
27 -
 28
28 -
 29
29 -
 30
30 -
 31
31 -
 32
32 -
 33
33 -
 34
34 -
 35
35 -
 36
36 -
 37
37 -
 38
38 -
 39
39 -
 40
40 -
 41
41 -
 42
42 -
 43
43 -
44
-
45
-
46
-
47
-
48
-
49
-
50
-
51
-
52
-
53
-
54
-
55
-
56
-
57
-
58
-
59
-
60
-
61
-
62
-
63
-
64
-
65
-
66
-
67
-
68
-
69
-
70
-
71
-
72
-
73
-
74
-
75
-
76
-
77
-
78
-
79
-
80
-
81
-
82
-
83
-
84
-
85
-
86
-
87
-
88
-
89
-
90
-
91
-
92
-
93
-
94
-
95
-
96
-
97
-
98
-
99
-
100
-
101
-
102
-
103
-
104
-
105
-
106
-
107
-
108
-
109
-
110
-
111
-
112
-
113
-
114
-
115
-
116
-
117
-
118
-
119
-
120
-
121
-
122
-
123
-
124
-
125
-
126
-
127
-
128
-
129
-
130
-
131
-
132
-
133
-
134
-
135
-
136
-
137
-
138
-
139
-
140
-
141
-
142
-
143
-
144
-
145
-
146
-
147
-
148
-
149
-
150
-
151
-
152
-
153
-
154
-
155
-
156
-
157
-
158
-
159
-
160
-
161
-
162
-
163
-
164
-
165
-
166
-
167
-
168
-
169
-
170
-
171
-
172
-
173
-
174
-
175
-
176
-
177
-
178
-
179
-
180
-
181
-
182
-
183
-
184
-
185
-
186
-
187
-
188
-
189
-
190
-
191
-
192
-
193
-
194
-
195
-
196
-
197
-
198
-
199
-
200
-
201
-
202
-
203
-
204
-
205
-
206
-
207
-
208
-
209
-
210
-
211
-
212
-
213
-
214
-
215
-
216
-
217
-
218
-
219
-
220
-
221
-
222
-
223
-
224
-
225
-
226
-
227
-
228
-
229
-
230
-
231
-
232
-
233
-
234
-
235
-
236
-
237
-
238
-
239
-
240
-
241
-
242
-
243
-
244
-
245
-
246
-
247
-
248
-
249
-
250
-
251
-
252
-
253
-
254
-
255
-
256
-
257
-
258
-
259
-
260
-
261
-
262
-
263
-
264
-
265
-
266
-
267
-
268
 |
 |
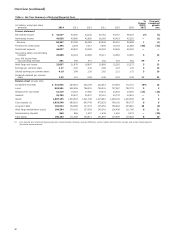
Balance Sheet and Liquidity
Our balance sheet grew 11% in 2014 to $1.7 trillion, as we
increased our liquidity position, improved the quality of our
assets and held more capital. We grew deposits by 8% in 2014
while reducing our deposit costs. We also grew our loans on a
year-over-year basis for the 14th consecutive quarter (for the
past 11 quarters year-over-year loan growth has been 3% or
greater) despite the planned runoff from our non-strategic/
liquidating portfolios. Our non-strategic/liquidating loan
portfolios decreased $20.1 billion during the year (now less than
8% of total loans) and our core loan portfolios increased
$60.3 billion from the prior year. Our federal funds sold,
securities purchased under resale agreements and other short-
term investments (collectively referred to as federal funds sold
and other short-term investments elsewhere in this Report)
increased by $44.6 billion, or 21%, during the year on continued
strong growth in interest-earning deposits, and we grew our
investment securities portfolio by $48.6 billion in 2014. While
we believe our liquidity position continued to remain strong with
increased regulatory expectations, we have added to our position
over the past year. We issued $24.0 billion of liquidity-related
long-term debt as well as additional liquidity-related short-term
funding in 2014.
Deposit growth remained strong with period-end deposits
up $89.1 billion from 2013. This increase reflected solid growth
across both our commercial and consumer businesses. We grew
our primary consumer checking customers by 5.2% and primary
small business and business banking checking customers by
5.4% from a year ago (November 2014 compared with November
2013). Our ability to grow primary customers is important to our
results because these customers have more interactions with us,
have higher cross-sell and are more than twice as profitable as
non-primary customers.
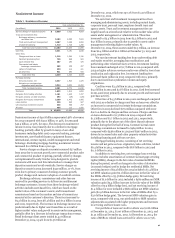
Credit Quality
Credit quality continued to improve in 2014, with solid
performance in several of our commercial and consumer loan
portfolios as losses remained near historically low levels,
reflecting our long-term risk focus and the benefit from the
improving housing market. Net charge-offs of $2.9 billion were
0.35% of average loans, down 21 basis points from a year ago.
Net losses in our commercial portfolio were only $44 million, or
1 basis point of average loans. Net consumer losses declined to
65 basis points in 2014 from 98 basis points in 2013. Our
commercial real estate portfolios were in a net recovery position
for each quarter of 2014 and 2013, reflecting our conservative
risk discipline and improved market conditions. Losses on our
consumer real estate portfolios declined $1.4 billion, or 55%,
from a year ago. The consumer loss levels reflected the benefit of
the improving economy and our continued focus on originating
high quality loans. Approximately 60% of the consumer first
mortgage portfolio was originated after 2008, when new
underwriting standards were implemented.
Reflecting these improvements in our loan portfolios, our
provision for credit losses in 2014 was $1.4 billion compared
with $2.3 billion a year ago. This provision reflected a release of
$1.6 billion from the allowance for credit losses, compared with a
release of $2.2 billion a year ago. Future allowance levels may
increase or decrease based on a variety of factors, including loan
growth, portfolio performance and general economic conditions.
In addition to lower net charge-offs and provision expense,
nonperforming assets (NPAs) also improved and were down
$4.1 billion, or 21%, from 2013. Nonaccrual loans declined
$2.8 billion from the prior year while foreclosed assets were
down $1.3 billion from 2013.
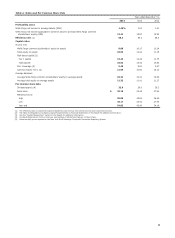
Capital
We continued to strengthen our capital levels in 2014 even as we
returned more capital to our shareholders, increasing total
equity to $185.3 billion at December 31, 2014, up $14.3 billion
from the prior year. In 2014, our common shares outstanding
declined by 86.8 million shares as we continued to reduce our
common share count through the repurchase of 183.1 million
common shares during the year. Also, we entered into a
$750 million forward repurchase contract with an unrelated
third party in October 2014 that settled in January 2015 for
14.3 million shares. In addition, we entered into another
$750 million forward repurchase contract with an unrelated
third party in January 2015 that is expected to settle in second
quarter 2015 for approximately 14.3 million shares. We expect
our share count to continue to decline in 2015 as a result of
anticipated net share repurchases.
We believe an important measure of our capital strength is
the estimated Common Equity Tier 1 ratio under Basel III, using
the Advanced Approach, fully phased-in, which increased to
10.43% in 2014 from 9.76% a year ago.
Our regulatory capital ratios under Basel III (General
Approach) remained strong with a total risk-based capital ratio
of 15.53%, Tier 1 risk-based capital ratio of 12.45% and Tier 1
leverage ratio of 9.45% at December 31, 2014, compared with
15.43%, 12.33% and 9.60%, respectively, at December 31, 2013.
See the “Capital Management” section in this Report for more
information regarding our capital, including the calculation of
common equity for regulatory purposes.
31