Wells Fargo 2014 Annual Report Download - page 97
Download and view the complete annual report
Please find page 97 of the 2014 Wells Fargo annual report below. You can navigate through the pages in the report by either clicking on the pages listed below, or by using the keyword search tool below to find specific information within the annual report.-
 1
1 -
2
-
3
-
4
-
5
-
6
-
7
-
8
-
9
-
10
-
11
-
12
-
13
-
14
-
15
-
16
-
17
-
18
-
19
-
20
-
21
-
22
-
23
-
24
-
25
-
26
-
27
-
28
-
29
-
30
-
31
-
32
-
33
-
34
-
35
-
36
-
37
-
38
-
39
-
40
-
41
-
42
-
43
-
44
-
45
-
46
-
47
-
48
-
49
-
50
-
51
-
52
-
53
-
54
-
55
-
56
-
57
-
58
-
59
-
60
-
61
-
62
-
63
-
64
-
65
-
66
-
67
-
68
-
69
-
70
-
71
-
72
-
73
-
74
-
75
-
76
-
77
-
78
-
79
-
80
-
81
-
82
-
83
-
84
-
85
-
86
-
 87
87 -
 88
88 -
 89
89 -
 90
90 -
 91
91 -
 92
92 -
 93
93 -
 94
94 -
 95
95 -
 96
96 -
 97
97 -
 98
98 -
 99
99 -
 100
100 -
 101
101 -
 102
102 -
 103
103 -
 104
104 -
 105
105 -
 106
106 -
 107
107 -
108
-
109
-
110
-
111
-
112
-
113
-
114
-
115
-
116
-
117
-
118
-
119
-
120
-
121
-
122
-
123
-
124
-
125
-
126
-
127
-
128
-
129
-
130
-
131
-
132
-
133
-
134
-
135
-
136
-
137
-
138
-
139
-
140
-
141
-
142
-
143
-
144
-
145
-
146
-
147
-
148
-
149
-
150
-
151
-
152
-
153
-
154
-
155
-
156
-
157
-
158
-
159
-
160
-
161
-
162
-
163
-
164
-
165
-
166
-
167
-
168
-
169
-
170
-
171
-
172
-
173
-
174
-
175
-
176
-
177
-
178
-
179
-
180
-
181
-
182
-
183
-
184
-
185
-
186
-
187
-
188
-
189
-
190
-
191
-
192
-
193
-
194
-
195
-
196
-
197
-
198
-
199
-
200
-
201
-
202
-
203
-
204
-
205
-
206
-
207
-
208
-
209
-
210
-
211
-
212
-
213
-
214
-
215
-
216
-
217
-
218
-
219
-
220
-
221
-
222
-
223
-
224
-
225
-
226
-
227
-
228
-
229
-
230
-
231
-
232
-
233
-
234
-
235
-
236
-
237
-
238
-
239
-
240
-
241
-
242
-
243
-
244
-
245
-
246
-
247
-
248
-
249
-
250
-
251
-
252
-
253
-
254
-
255
-
256
-
257
-
258
-
259
-
260
-
261
-
262
-
263
-
264
-
265
-
266
-
267
-
268
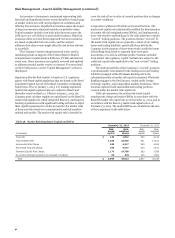
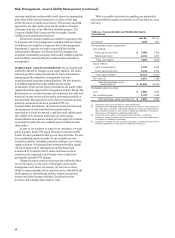
 |
 |

risk capital rule. Clean P&L is the change in the value of the
Company’s covered trading positions that would have occurred
had previous end-of-day covered trading positions remained
unchanged (therefore, excluding fees, commissions, net interest
income, and intraday trading gains and losses). The backtesting
analysis compares the daily Total VaR for each of the trading
days in the preceding 12 months with the net clean P&L. Clean
P&L does not include credit adjustments and other activity not
representative of daily price changes driven by market risk
factors. The clean P&L measure of revenue is used to evaluate
the performance of the Total VaR and is not comparable to our
actual daily trading net revenues, as reported elsewhere in this
Report.
Any observed clean P&L loss in excess of the Total VaR is
considered a market risk regulatory capital backtesting
exception. The actual number of exceptions (that is, the number
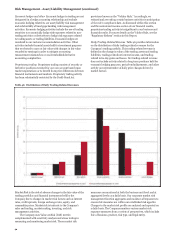
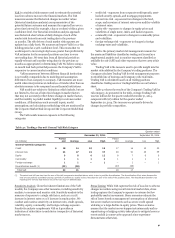
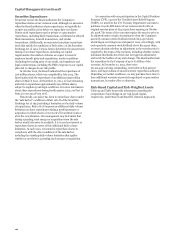
Table 53: Daily Total 1-Day 99% VaR Measure (Rolling 12 Months)
of business days for which the clean P&L losses exceed the
corresponding 1-day, 99% Total VaR measure) over the
preceding 12 months is used to determine the capital multiplier
for the capital calculation. The number of actual backtesting
exceptions is dependent on current market performance relative
to historic market volatility. This capital multiplier increases
from a minimum of three to a maximum of four, depending on
the number of exceptions. No backtesting exceptions occurred
over the preceding 12 months. Backtesting is also performed at
granular levels within the Company with sub-portfolio results
provided to federal regulators.
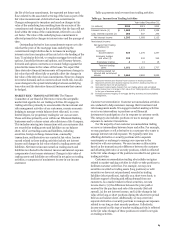
Table 53 shows daily Total VaR (1-day, 99%) for the 12
months ended December 31, 2014. The Company’s average Total
VaR for fourth quarter 2014 was $22 million with a low of $17
million and a high of $28 million.
Market Risk Governance The Finance Committee of our Board
has primary oversight over market risk-taking activities of the
Company and reviews the acceptable market risk appetite. The
Corporate Risk Group’s Market Risk Committee, which reports
to the Finance Committee of the Board, is responsible for
governance and oversight over market risk-taking activities
across the Company as well as the establishment of market risk
appetite and associated limits. The Corporate Market Risk
Group, which is part of the Corporate Risk Group, administers
and monitors compliance with the requirements established by
the Market Risk Committee. The Corporate Market Risk Group
has oversight responsibilities in identifying, measuring and
monitoring the Company’s market risk. The group is responsible
for developing corporate market risk policy, creating
quantitative market risk models, establishing independent risk
limits, calculating and analyzing market risk capital, and
reporting aggregated and line-of-business market risk
information. Limits are regularly reviewed to ensure they remain
relevant and within the market risk appetite for the Company.
An automated limits-monitoring system enables a daily
comprehensive review of multiple limits mandated across
businesses. Limits are set with inner boundaries that will be
periodically breached to promote an ongoing dialogue of risk
exposure within the Company. Each line of business that exposes
the Company to market risk has direct responsibility for
managing market risk in accordance with defined risk tolerances
and approved market risk mandates and hedging strategies. We
measure and monitor market risk for both management and
regulatory capital purposes.
Model Risk Management The market risk capital models are
governed by our Corporate Model Risk Committee (CMoR)
policies and procedures, which include model validation. The
purpose of model validation includes ensuring the model is
appropriate for its intended use and that appropriate controls
exist to help mitigate the risk of invalid results. Model validation
assesses the adequacy and appropriateness of the model,
including reviewing its key components such as inputs,
processing components, logic or theory, output results and
supporting model documentation. Validation also includes
95