Wells Fargo 2014 Annual Report Download - page 50
Download and view the complete annual report
Please find page 50 of the 2014 Wells Fargo annual report below. You can navigate through the pages in the report by either clicking on the pages listed below, or by using the keyword search tool below to find specific information within the annual report.-
 1
1 -
2
-
3
-
4
-
5
-
6
-
7
-
8
-
9
-
10
-
11
-
12
-
13
-
14
-
15
-
16
-
17
-
18
-
19
-
20
-
21
-
22
-
23
-
24
-
25
-
26
-
27
-
28
-
29
-
30
-
31
-
32
-
33
-
34
-
35
-
36
-
37
-
38
-
39
-
 40
40 -
 41
41 -
 42
42 -
 43
43 -
 44
44 -
 45
45 -
 46
46 -
 47
47 -
 48
48 -
 49
49 -
 50
50 -
 51
51 -
 52
52 -
 53
53 -
 54
54 -
 55
55 -
 56
56 -
 57
57 -
 58
58 -
 59
59 -
 60
60 -
61
-
62
-
63
-
64
-
65
-
66
-
67
-
68
-
69
-
70
-
71
-
72
-
73
-
74
-
75
-
76
-
77
-
78
-
79
-
80
-
81
-
82
-
83
-
84
-
85
-
86
-
87
-
88
-
89
-
90
-
91
-
92
-
93
-
94
-
95
-
96
-
97
-
98
-
99
-
100
-
101
-
102
-
103
-
104
-
105
-
106
-
107
-
108
-
109
-
110
-
111
-
112
-
113
-
114
-
115
-
116
-
117
-
118
-
119
-
120
-
121
-
122
-
123
-
124
-
125
-
126
-
127
-
128
-
129
-
130
-
131
-
132
-
133
-
134
-
135
-
136
-
137
-
138
-
139
-
140
-
141
-
142
-
143
-
144
-
145
-
146
-
147
-
148
-
149
-
150
-
151
-
152
-
153
-
154
-
155
-
156
-
157
-
158
-
159
-
160
-
161
-
162
-
163
-
164
-
165
-
166
-
167
-
168
-
169
-
170
-
171
-
172
-
173
-
174
-
175
-
176
-
177
-
178
-
179
-
180
-
181
-
182
-
183
-
184
-
185
-
186
-
187
-
188
-
189
-
190
-
191
-
192
-
193
-
194
-
195
-
196
-
197
-
198
-
199
-
200
-
201
-
202
-
203
-
204
-
205
-
206
-
207
-
208
-
209
-
210
-
211
-
212
-
213
-
214
-
215
-
216
-
217
-
218
-
219
-
220
-
221
-
222
-
223
-
224
-
225
-
226
-
227
-
228
-
229
-
230
-
231
-
232
-
233
-
234
-
235
-
236
-
237
-
238
-
239
-
240
-
241
-
242
-
243
-
244
-
245
-
246
-
247
-
248
-
249
-
250
-
251
-
252
-
253
-
254
-
255
-
256
-
257
-
258
-
259
-
260
-
261
-
262
-
263
-
264
-
265
-
266
-
267
-
268
 |
 |

Earnings Performance (continued)
trading assets, lower insurance income related to a decline in
crop insurance fee income and the 2014 divestiture of 40
insurance offices, and lower other income. The reduction in
other income was caused by the financial results of low-income
housing tax credits and other nonmarketable investments which
are accounted for under the equity accounting method, partially
offset by a gain on the divestiture of the 40 insurance offices.
Noninterest income of $11.8 billion in 2013 increased
$322 million, or 3%, from 2012 due to strong growth in asset
backed finance, asset management, capital markets, commercial
banking, commercial real estate and corporate banking.
Noninterest expense in 2014 increased $597 million, or 5%,
compared with 2013, which was up 2%, or $296 million, from
2012. The increase in both 2014 and 2013 was due to higher
personnel expenses and higher non-personnel expenses related
to growth initiatives and compliance and regulatory
requirements. The provision for credit losses increased
$179 million from 2013 due primarily to strong commercial loan
growth in 2014. The provision for credit losses in 2013 decreased
$731 million from 2012, due to lower loan losses.
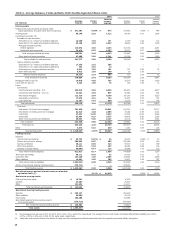
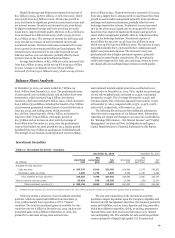
Table 9c - Wealth, Brokerage and Retirement
WEALTH, BROKERAGE AND RETIREMENT provides a full
range of financial advisory services to clients using a planning
approach to meet each client's financial needs. Wealth
Management provides affluent and high net worth clients with a
complete range of wealth management solutions, including
financial planning, private banking, credit, investment
management and fiduciary services. Abbot Downing, a
Wells Fargo business, provides comprehensive wealth
management services to ultra-high net worth families and
individuals as well as endowments and foundations. Brokerage
serves customers' advisory, brokerage and financial needs as
part of one of the largest full-service brokerage firms in the
United States. Retirement is a national leader in providing
institutional retirement and trust services (including 401(k) and
pension plan record keeping) for businesses and reinsurance
services for the life insurance industry. Wealth, Brokerage and
Retirement cross-sell was 10.49 products per retail banking
household in November 2014, up from 10.42 in November 2013
and 10.27 in November 2012. Table 9c provides additional
financial information for Wealth, Brokerage and Retirement.
Year ended December 31,
(in millions, except average balances which are in billions) 2014 2013 2012
Net interest income $ 3,179 2,888 2,768
Noninterest income:
Service charges on deposit accounts 18 17 18
Trust and investment fees:
Brokerage advisory, commissions and other fees 8,855 8,133 7,299
Trust and investment management 1,595 1,532 1,435
Investment banking (1) (13) (16) (14)
Total trust and investment fees 10,437 9,649 8,720
Card fees 4 4 1
Other fees 16 19 18
Mortgage banking 1 (24) (38)
Insurance 176 125 118
Net gains from trading activities 155 171 151
Net gains on debt securities 5 3 5
Net gains from equity investments 13 14 99
Other income of the segment 214 337 300
Total noninterest income 11,039 10,315 9,392
Total revenue 14,218 13,203 12,160
Provision (reversal of provision) for credit losses (50) (16) 125
Noninterest expense:
Personnel expense 7,320 7,093 6,544
Equipment 51 63 47
Net occupancy 412 399 404
Core deposit and other intangibles 350 382 420
FDIC and other deposit assessments 127 136 236
Outside professional services 491 412 388
Operating losses 93 90 29
Other expense of the segment 2,063 1,880 1,825
Total noninterest expense 10,907 10,455 9,893
Income before income tax expense and noncontrolling interest 3,361 2,764 2,142
Income tax expense 1,276 1,050 814
Net income from noncontrolling interest 2 2 —
Net income $ 2,083 1,712 1,328
Average loans $ 52.1 46.1 42.7
Average core deposits 154.9 150.1 137.5
(1) Represents syndication and underwriting fees paid to Wells Fargo Securities which are offset in our Wholesale Banking segment.
48