Wells Fargo 2014 Annual Report Download - page 74
Download and view the complete annual report
Please find page 74 of the 2014 Wells Fargo annual report below. You can navigate through the pages in the report by either clicking on the pages listed below, or by using the keyword search tool below to find specific information within the annual report.-
 1
1 -
2
-
3
-
4
-
5
-
6
-
7
-
8
-
9
-
10
-
11
-
12
-
13
-
14
-
15
-
16
-
17
-
18
-
19
-
20
-
21
-
22
-
23
-
24
-
25
-
26
-
27
-
28
-
29
-
30
-
31
-
32
-
33
-
34
-
35
-
36
-
37
-
38
-
39
-
40
-
41
-
42
-
43
-
44
-
45
-
46
-
47
-
48
-
49
-
50
-
51
-
52
-
53
-
54
-
55
-
56
-
57
-
58
-
59
-
60
-
61
-
62
-
63
-
 64
64 -
 65
65 -
 66
66 -
 67
67 -
 68
68 -
 69
69 -
 70
70 -
 71
71 -
 72
72 -
 73
73 -
 74
74 -
 75
75 -
 76
76 -
 77
77 -
 78
78 -
 79
79 -
 80
80 -
 81
81 -
 82
82 -
 83
83 -
 84
84 -
85
-
86
-
87
-
88
-
89
-
90
-
91
-
92
-
93
-
94
-
95
-
96
-
97
-
98
-
99
-
100
-
101
-
102
-
103
-
104
-
105
-
106
-
107
-
108
-
109
-
110
-
111
-
112
-
113
-
114
-
115
-
116
-
117
-
118
-
119
-
120
-
121
-
122
-
123
-
124
-
125
-
126
-
127
-
128
-
129
-
130
-
131
-
132
-
133
-
134
-
135
-
136
-
137
-
138
-
139
-
140
-
141
-
142
-
143
-
144
-
145
-
146
-
147
-
148
-
149
-
150
-
151
-
152
-
153
-
154
-
155
-
156
-
157
-
158
-
159
-
160
-
161
-
162
-
163
-
164
-
165
-
166
-
167
-
168
-
169
-
170
-
171
-
172
-
173
-
174
-
175
-
176
-
177
-
178
-
179
-
180
-
181
-
182
-
183
-
184
-
185
-
186
-
187
-
188
-
189
-
190
-
191
-
192
-
193
-
194
-
195
-
196
-
197
-
198
-
199
-
200
-
201
-
202
-
203
-
204
-
205
-
206
-
207
-
208
-
209
-
210
-
211
-
212
-
213
-
214
-
215
-
216
-
217
-
218
-
219
-
220
-
221
-
222
-
223
-
224
-
225
-
226
-
227
-
228
-
229
-
230
-
231
-
232
-
233
-
234
-
235
-
236
-
237
-
238
-
239
-
240
-
241
-
242
-
243
-
244
-
245
-
246
-
247
-
248
-
249
-
250
-
251
-
252
-
253
-
254
-
255
-
256
-
257
-
258
-
259
-
260
-
261
-
262
-
263
-
264
-
265
-
266
-
267
-
268
 |
 |

Risk Management - Credit Risk Management (continued)
line from a variable interest rate to a fixed rate with terms
including interest-only payments for a fixed period between
three to seven years or a fully amortizing payment with a fixed
period between five to 30 years. At the end of the draw period, a
line of credit generally converts to an amortizing payment
schedule with repayment terms of up to 30 years based on the
balance at time of conversion. Certain lines and loans have been
structured with a balloon payment, which requires full
repayment of the outstanding balance at the end of the term
period. The conversion of lines or loans to fully amortizing or
balloon payoff may result in a significant payment increase,
which can affect some borrowers’ ability to repay the
outstanding balance.
The lines that enter their amortization period may
experience higher delinquencies and higher loss rates than the
ones in their draw or term period. We have considered this
increased inherent risk in our allowance for credit loss estimate.
In anticipation of our borrowers reaching the end of their
contractual commitment, we have created a program to inform,
educate and help these borrowers transition from interest-only
to fully-amortizing payments or full repayment. We monitor the
performance of the borrowers moving through the program in
an effort to refine our ongoing program strategy.
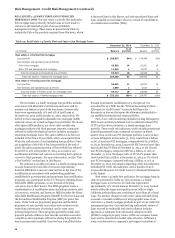
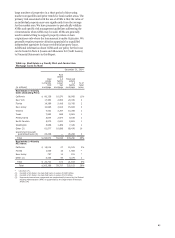
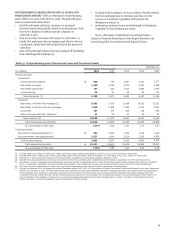
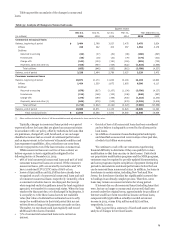
Table 30 reflects the outstanding balance of our portfolio of
junior lien lines and loans and senior lien lines segregated into
scheduled end of draw or end of term periods and products that
are currently amortizing, or in balloon repayment status. It
excludes real estate 1-4 family first lien line reverse mortgages,
which total $2.3 billion, because they are predominantly insured
by the FHA, and it excludes PCI loans, which total $130 million,
because their losses were generally reflected in our
nonaccretable difference established at the date of acquisition.
Table 30: Junior Lien Mortgage Line and Loan and Senior Lien Mortgage Line Portfolios Payment Schedule
Scheduled end of draw / term
Outstanding balance 2020 and
(in millions) December 31, 2014 2015 2016 2017 2018 2019 thereafter (1) Amortizing
Junior residential lines $ 52,658 4,813 6,451 6,692 3,633 1,422 24,639 5,008
Junior loans (2) 6,958 65 98 103 11 8 1,175 5,498
Total junior lien (3)(4) 59,616 4,878 6,549 6,795 3,644 1,430 25,814 10,506
First lien lines 17,080 1,089 923 932 1,053 467 11,394 1,222
Total (3)(4) $ 76,696 5,967 7,472 7,727 4,697 1,897 37,208 11,728
% of portfolios 100% 7.8% 9.7% 10.1% 6.1% 2.5% 48.5% 15.3%
(1) The annual scheduled end of draw or term ranges from $1.7 billion to $10.0 billion and averages $5.3 billion per year for 2020 and thereafter. The loans that convert in
2025 and thereafter have draw periods that generally extend to 15 or 20 years.
(2) Junior loans within the term period predominantly represent principal and interest products that require a balloon payment upon the end of the loan term. Amortizing junior
loans include $62 million of balloon loans that have reached end of term and are now past due.
(3) Lines in their draw period are predominantly interest-only. The unfunded credit commitments total $70.1 billion at December 31, 2014.
(4) Includes scheduled end-of-term balloon payments totaling $455 million, $386 million, $501 million, $518 million, $445 million, and $1.9 billion for 2015, 2016, 2017, 2018,
2019, 2020 and thereafter, respectively. Amortizing lines include $189 million of end-of-term balloon payments, which are past due. At December 31, 2014, $425 million,
or 7% of outstanding lines of credit that are amortizing, are 30 or more days past due compared to $1.3 billion, or 2% for lines in their draw period.
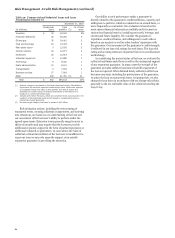
CREDIT CARDS Our credit card portfolio totaled $31.1 billion at
December 31, 2014, which represented 4% of our total
outstanding loans. In November 2014, we purchased an existing
private label and co-branded credit card loan portfolio in
connection with the Dillard's program agreement. The net
charge-off rate for our credit card portfolio was 3.14% for 2014,
compared with 3.62% for 2013.
AUTOMOBILE Our automobile portfolio, predominantly
composed of indirect loans, totaled $55.7 billion at December 31,
2014. The net charge-off rate for our automobile portfolio was
0.70% for 2014, compared with 0.63% for 2013.
OTHER REVOLVING CREDIT AND INSTALLMENT Other
revolving credit and installment loans totaled $35.8 billion at
December 31, 2014, and primarily included student and security-
based loans. Student loans totaled $11.9 billion at December 31,
2014, compared with $22.0 billion at December 31, 2013,
reflecting the transfer of $9.7 billion in government guaranteed
student loans to loans held for sale at June 30, 2014, of which
$8.3 billion were sold in fourth quarter 2014. The net charge-off
rate for other revolving credit and installment loans was 1.35%
for 2014, compared with 1.41% for 2013.
72