Wells Fargo 2014 Annual Report Download - page 172
Download and view the complete annual report
Please find page 172 of the 2014 Wells Fargo annual report below. You can navigate through the pages in the report by either clicking on the pages listed below, or by using the keyword search tool below to find specific information within the annual report.-
 1
1 -
2
-
3
-
4
-
5
-
6
-
7
-
8
-
9
-
10
-
11
-
12
-
13
-
14
-
15
-
16
-
17
-
18
-
19
-
20
-
21
-
22
-
23
-
24
-
25
-
26
-
27
-
28
-
29
-
30
-
31
-
32
-
33
-
34
-
35
-
36
-
37
-
38
-
39
-
40
-
41
-
42
-
43
-
44
-
45
-
46
-
47
-
48
-
49
-
50
-
51
-
52
-
53
-
54
-
55
-
56
-
57
-
58
-
59
-
60
-
61
-
62
-
63
-
64
-
65
-
66
-
67
-
68
-
69
-
70
-
71
-
72
-
73
-
74
-
75
-
76
-
77
-
78
-
79
-
80
-
81
-
82
-
83
-
84
-
85
-
86
-
87
-
88
-
89
-
90
-
91
-
92
-
93
-
94
-
95
-
96
-
97
-
98
-
99
-
100
-
101
-
102
-
103
-
104
-
105
-
106
-
107
-
108
-
109
-
110
-
111
-
112
-
113
-
114
-
115
-
116
-
117
-
118
-
119
-
120
-
121
-
122
-
123
-
124
-
125
-
126
-
127
-
128
-
129
-
130
-
131
-
132
-
133
-
134
-
135
-
136
-
137
-
138
-
139
-
140
-
141
-
142
-
143
-
144
-
145
-
146
-
147
-
148
-
149
-
150
-
151
-
152
-
153
-
154
-
155
-
156
-
157
-
158
-
159
-
160
-
161
-
 162
162 -
 163
163 -
 164
164 -
 165
165 -
 166
166 -
 167
167 -
 168
168 -
 169
169 -
 170
170 -
 171
171 -
 172
172 -
 173
173 -
 174
174 -
 175
175 -
 176
176 -
 177
177 -
 178
178 -
 179
179 -
 180
180 -
 181
181 -
 182
182 -
183
-
184
-
185
-
186
-
187
-
188
-
189
-
190
-
191
-
192
-
193
-
194
-
195
-
196
-
197
-
198
-
199
-
200
-
201
-
202
-
203
-
204
-
205
-
206
-
207
-
208
-
209
-
210
-
211
-
212
-
213
-
214
-
215
-
216
-
217
-
218
-
219
-
220
-
221
-
222
-
223
-
224
-
225
-
226
-
227
-
228
-
229
-
230
-
231
-
232
-
233
-
234
-
235
-
236
-
237
-
238
-
239
-
240
-
241
-
242
-
243
-
244
-
245
-
246
-
247
-
248
-
249
-
250
-
251
-
252
-
253
-
254
-
255
-
256
-
257
-
258
-
259
-
260
-
261
-
262
-
263
-
264
-
265
-
266
-
267
-
268
 |
 |

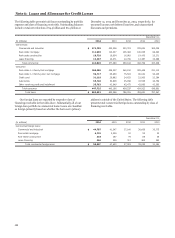
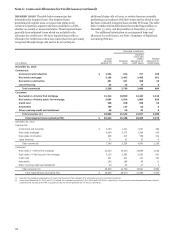
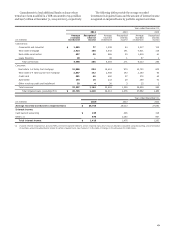
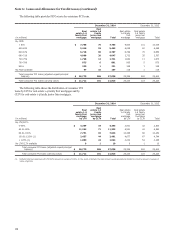
Note 6: Loans and Allowance for Credit Losses (continued)
IMPAIRED LOANS The table below summarizes key
information for impaired loans. Our impaired loans
predominantly include loans on nonaccrual status in the
commercial portfolio segment and loans modified in a TDR,
whether on accrual or nonaccrual status. These impaired loans
generally have estimated losses which are included in the
allowance for credit losses. We have impaired loans with no
allowance for credit losses when loss content has been previously
recognized through charge-offs and we do not anticipate
additional charge-offs or losses, or certain loans are currently
performing in accordance with their terms and for which no loss
has been estimated. Impaired loans exclude PCI loans. The table
below includes trial modifications that totaled $452 million at
December 31, 2014, and $650 million at December 31, 2013.
For additional information on our impaired loans and
allowance for credit losses, see Note 1 (Summary of Significant
Accounting Policies).
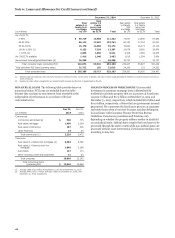
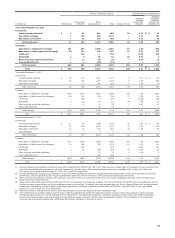
Recorded investment
Impaired
loans with
Unpaid related Related
principal Impaired allowance for allowance for
(in millions) balance (1) loans credit losses credit losses
December 31, 2014
Commercial:
Commercial and industrial $ 1,524 926 757 240
Real estate mortgage 3,190 2,483 2,405 591
Real estate construction 491 331 308 45
Lease financing 33 19 19 8
Total commercial 5,238 3,759 3,489 884
Consumer:
Real estate 1-4 family first mortgage 21,324 18,600 12,433 2,322
Real estate 1-4 family junior lien mortgage 3,094 2,534 2,009 653
Credit card 338 338 338 98
Automobile 190 127 55 8
Other revolving credit and installment 60 50 42 5
Total consumer (2) 25,006 21,649 14,877 3,086
Total impaired loans (excluding PCI) $ 30,244 25,408 18,366 3,970
December 31, 2013
Commercial:
Commercial and industrial $ 2,060 1,311 1,061 228
Real estate mortgage 4,269 3,375 3,264 819
Real estate construction 946 615 589 101
Lease financing 71 33 33 8
Total commercial 7,346 5,334 4,947 1,156
Consumer:
Real estate 1-4 family first mortgage 22,450 19,500 13,896 3,026
Real estate 1-4 family junior lien mortgage 3,130 2,582 2,092 681
Credit card 431 431 431 132
Automobile 245 189 95 11
Other revolving credit and installment 44 34 27 3
Total consumer (2) 26,300 22,736 16,541 3,853
Total impaired loans (excluding PCI) $ 33,646 28,070 21,488 5,009
(1) Excludes the unpaid principal balance for loans that have been fully charged off or otherwise have zero recorded investment.
(2) Years ended December 31, 2014 and 2013, include the recorded investment of $2.1 billion and $2.5 billion, respectively, of government insured/guaranteed loans that are
predominantly insured by the FHA or guaranteed by the VA and generally do not have an allowance.
170