Wells Fargo 2014 Annual Report Download - page 184
Download and view the complete annual report
Please find page 184 of the 2014 Wells Fargo annual report below. You can navigate through the pages in the report by either clicking on the pages listed below, or by using the keyword search tool below to find specific information within the annual report.-
 1
1 -
2
-
3
-
4
-
5
-
6
-
7
-
8
-
9
-
10
-
11
-
12
-
13
-
14
-
15
-
16
-
17
-
18
-
19
-
20
-
21
-
22
-
23
-
24
-
25
-
26
-
27
-
28
-
29
-
30
-
31
-
32
-
33
-
34
-
35
-
36
-
37
-
38
-
39
-
40
-
41
-
42
-
43
-
44
-
45
-
46
-
47
-
48
-
49
-
50
-
51
-
52
-
53
-
54
-
55
-
56
-
57
-
58
-
59
-
60
-
61
-
62
-
63
-
64
-
65
-
66
-
67
-
68
-
69
-
70
-
71
-
72
-
73
-
74
-
75
-
76
-
77
-
78
-
79
-
80
-
81
-
82
-
83
-
84
-
85
-
86
-
87
-
88
-
89
-
90
-
91
-
92
-
93
-
94
-
95
-
96
-
97
-
98
-
99
-
100
-
101
-
102
-
103
-
104
-
105
-
106
-
107
-
108
-
109
-
110
-
111
-
112
-
113
-
114
-
115
-
116
-
117
-
118
-
119
-
120
-
121
-
122
-
123
-
124
-
125
-
126
-
127
-
128
-
129
-
130
-
131
-
132
-
133
-
134
-
135
-
136
-
137
-
138
-
139
-
140
-
141
-
142
-
143
-
144
-
145
-
146
-
147
-
148
-
149
-
150
-
151
-
152
-
153
-
154
-
155
-
156
-
157
-
158
-
159
-
160
-
161
-
162
-
163
-
164
-
165
-
166
-
167
-
168
-
169
-
170
-
171
-
172
-
173
-
 174
174 -
 175
175 -
 176
176 -
 177
177 -
 178
178 -
 179
179 -
 180
180 -
 181
181 -
 182
182 -
 183
183 -
 184
184 -
 185
185 -
 186
186 -
 187
187 -
 188
188 -
 189
189 -
 190
190 -
 191
191 -
 192
192 -
 193
193 -
 194
194 -
195
-
196
-
197
-
198
-
199
-
200
-
201
-
202
-
203
-
204
-
205
-
206
-
207
-
208
-
209
-
210
-
211
-
212
-
213
-
214
-
215
-
216
-
217
-
218
-
219
-
220
-
221
-
222
-
223
-
224
-
225
-
226
-
227
-
228
-
229
-
230
-
231
-
232
-
233
-
234
-
235
-
236
-
237
-
238
-
239
-
240
-
241
-
242
-
243
-
244
-
245
-
246
-
247
-
248
-
249
-
250
-
251
-
252
-
253
-
254
-
255
-
256
-
257
-
258
-
259
-
260
-
261
-
262
-
263
-
264
-
265
-
266
-
267
-
268
 |
 |
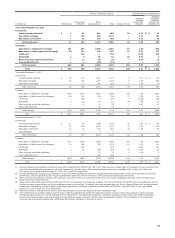
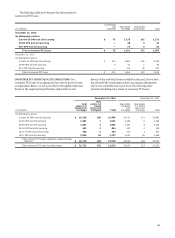
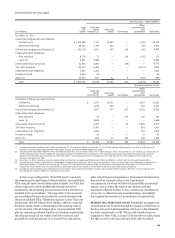
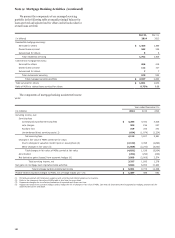
Note 8: Securitizations and Variable Interest Entities (continued)
following table where we have determined that our continuing borrowing transactions with unconsolidated VIEs (for
involvement is not significant due to the temporary nature and information on these transactions, see the Transactions with
size of our variable interests, because we were not the transferor Consolidated VIEs and Secured Borrowings section in this Note).
or because we were not involved in the design of the
unconsolidated VIEs. We also exclude from the table secured
Carrying value - asset (liability)
Other
Total Debt and commitments
(in millions) VIE
assets equity
interests (1) Servicing
assets Derivatives and
guarantees Net assets
December 31, 2014
Residential mortgage loan securitizations:
Conforming (2) $ 1,268,200 2,846 11,684 — (581) 13,949
Other/nonconforming 32,213 1,644 209 — (8) 1,845
Commercial mortgage securitizations 196,510 8,756 650 251 (32) 9,625
Collateralized debt obligations:
Debt securities 5,039 11 — 163 (105) 69
Loans (4) 5,347 5,221 — — — 5,221
Asset-based finance structures 18,954 13,044 — (71) — 12,973
Tax credit structures 22,859 7,809 — — (2,585) 5,224
Collateralized loan obligations 1,251 518 — — — 518
Investment funds 2,764 49 — — — 49
Other (5) 12,912 747 19 (18) (5) 743
Total $ 1,566,049 40,645 12,562 325 (3,316) 50,216
Maximum exposure to loss
Other
Debt and commitments
equity
interests (1) Servicing
assets Derivatives and
guarantees Net assets
Residential mortgage loan securitizations:
Conforming $ 2,846 11,684 — 2,507 17,037
Other/nonconforming 1,644 209 — 345 2,198
Commercial mortgage securitizations 8,756 650 251 5,715 15,372
Collateralized debt obligations:
Debt securities 11 — 163 105 279
Loans (4) 5,221 — — — 5,221
Asset-based finance structures 13,044 — 89 656 13,789
Tax credit structures 7,809 — — 725 8,534
Collateralized loan obligations 518 — — 38 556
Investment funds 49 — — — 49
Other (5) 747 19 150 156 1,072
Total $ 40,645 12,562 653 10,247 64,107
(continued on following page)
182