Wells Fargo 2014 Annual Report Download - page 208
Download and view the complete annual report
Please find page 208 of the 2014 Wells Fargo annual report below. You can navigate through the pages in the report by either clicking on the pages listed below, or by using the keyword search tool below to find specific information within the annual report.-
 1
1 -
2
-
3
-
4
-
5
-
6
-
7
-
8
-
9
-
10
-
11
-
12
-
13
-
14
-
15
-
16
-
17
-
18
-
19
-
20
-
21
-
22
-
23
-
24
-
25
-
26
-
27
-
28
-
29
-
30
-
31
-
32
-
33
-
34
-
35
-
36
-
37
-
38
-
39
-
40
-
41
-
42
-
43
-
44
-
45
-
46
-
47
-
48
-
49
-
50
-
51
-
52
-
53
-
54
-
55
-
56
-
57
-
58
-
59
-
60
-
61
-
62
-
63
-
64
-
65
-
66
-
67
-
68
-
69
-
70
-
71
-
72
-
73
-
74
-
75
-
76
-
77
-
78
-
79
-
80
-
81
-
82
-
83
-
84
-
85
-
86
-
87
-
88
-
89
-
90
-
91
-
92
-
93
-
94
-
95
-
96
-
97
-
98
-
99
-
100
-
101
-
102
-
103
-
104
-
105
-
106
-
107
-
108
-
109
-
110
-
111
-
112
-
113
-
114
-
115
-
116
-
117
-
118
-
119
-
120
-
121
-
122
-
123
-
124
-
125
-
126
-
127
-
128
-
129
-
130
-
131
-
132
-
133
-
134
-
135
-
136
-
137
-
138
-
139
-
140
-
141
-
142
-
143
-
144
-
145
-
146
-
147
-
148
-
149
-
150
-
151
-
152
-
153
-
154
-
155
-
156
-
157
-
158
-
159
-
160
-
161
-
162
-
163
-
164
-
165
-
166
-
167
-
168
-
169
-
170
-
171
-
172
-
173
-
174
-
175
-
176
-
177
-
178
-
179
-
180
-
181
-
182
-
183
-
184
-
185
-
186
-
187
-
188
-
189
-
190
-
191
-
192
-
193
-
194
-
195
-
196
-
197
-
 198
198 -
 199
199 -
 200
200 -
 201
201 -
 202
202 -
 203
203 -
 204
204 -
 205
205 -
 206
206 -
 207
207 -
 208
208 -
 209
209 -
 210
210 -
 211
211 -
 212
212 -
 213
213 -
 214
214 -
 215
215 -
 216
216 -
 217
217 -
 218
218 -
219
-
220
-
221
-
222
-
223
-
224
-
225
-
226
-
227
-
228
-
229
-
230
-
231
-
232
-
233
-
234
-
235
-
236
-
237
-
238
-
239
-
240
-
241
-
242
-
243
-
244
-
245
-
246
-
247
-
248
-
249
-
250
-
251
-
252
-
253
-
254
-
255
-
256
-
257
-
258
-
259
-
260
-
261
-
262
-
263
-
264
-
265
-
266
-
267
-
268
 |
 |

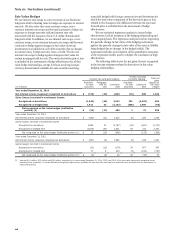
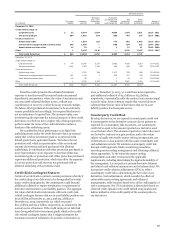
Note 16: Derivatives (continued)
December 31, 2014 December 31, 2013
Notional or Fair value Notional or Fair value
contractual Asset Liability contractual Asset Liability
(in millions) amount derivatives derivatives amount derivatives derivatives
Derivatives designated as hedging instruments
Interest rate contracts (1) $ 148,967 6,536 2,435 100,412 4,315 2,528
Foreign exchange contracts (1) 26,778 752 1,347 26,483 1,091 847
Total derivatives designated as
qualifying hedging instruments 7,288 3,782 5,406 3,375
Derivatives not designated as hedging instruments
Economic hedges:
Interest rate contracts (2) 221,527 697 487 220,577 595 897
Equity contracts 5,219 367 96 3,273 349 206
Foreign exchange contracts 14,405 275 28 10,064 21 35
Subtotal (3) 1,339 611 965 1,138
Customer accommodation, trading and
other derivatives:
Interest rate contracts 4,378,767 56,465 57,137 4,030,068 50,936 53,113
Commodity contracts 88,640 7,461 7,702 96,889 2,673 2,603
Equity contracts 138,422 8,638 6,942 96,379 7,475 7,588
Foreign exchange contracts 253,742 6,377 6,452 164,160 3,731 3,626
Credit contracts - protection sold 12,304 151 943 19,501 354 1,532
Credit contracts - protection purchased 16,659 755 168 23,314 1,147 368
Other derivatives (3) 1,994 — 44 2,160 13 16
Subtotal (3) 79,847 79,388 66,329 68,846
Total derivatives not designated as hedging instruments 81,186 79,999 67,294 69,984
Total derivatives before netting 88,474 83,781 72,700 73,359
Netting (4) (65,869) (65,043) (56,894) (63,739)
Total $ 22,605 18,738 15,806 9,620
(1) Notional amounts presented exclude $1.9 billion of interest rate contracts at both December 31, 2014 and 2013, for certain derivatives that are combined for designation
as a hedge on a single instrument. The notional amount for foreign exchange contracts at December 31, 2014, excludes $2.7 billion for certain derivatives that are
combined for designation as a hedge on a single instrument.
(2) Includes economic hedge derivatives used to hedge the risk of changes in the fair value of residential MSRs, MHFS, loans, derivative loan commitments and other interests
held.
(3) Prior period has been revised to conform with current period presentation.
(4) Represents balance sheet netting of derivative asset and liability balances, related cash collateral and portfolio level counterparty valuation adjustments. See the next table
in this Note for further information.
The following table provides information on the gross fair
values of derivative assets and liabilities, the balance sheet
netting adjustments and the resulting net fair value amount
recorded on our balance sheet, as well as the non-cash collateral
associated with such arrangements. We execute substantially all
of our derivative transactions under master netting
arrangements. We reflect all derivative balances and related cash
collateral subject to enforceable master netting arrangements on
a net basis within the balance sheet. The “Gross amounts
recognized” column in the following table include $69.6 billion
and $75.0 billion of gross derivative assets and liabilities,
respectively, at December 31, 2014, and $59.8 billion and
$66.1 billion, respectively, at December 31, 2013, with
counterparties subject to enforceable master netting
arrangements that are carried on the balance sheet net of
offsetting amounts. The remaining gross derivative assets and
liabilities of $18.9 billion and $8.8 billion, respectively, at
December 31, 2014 and $12.9 billion and $7.3 billion,
respectively, at December 31, 2013, include those with
counterparties subject to master netting arrangements for which
we have not assessed the enforceability because they are with
counterparties where we do not currently have positions to
offset, those subject to master netting arrangements where we
have not been able to confirm the enforceability and those not
subject to master netting arrangements. As such,we do not net
derivative balances or collateral within the balance sheet for
these counterparties.
We determine the balance sheet netting adjustments based
on the terms specified within each master netting arrangement.
We disclose the balance sheet netting amounts within the
column titled “Gross amounts offset in consolidated balance
sheet.” Balance sheet netting adjustments are determined at the
counterparty level for which there may be multiple contract
types. For disclosure purposes, we allocate these adjustments to
the contract type for each counterparty proportionally based
upon the “Gross amounts recognized” by counterparty. As a
result, the net amounts disclosed by contract type may not
represent the actual exposure upon settlement of the contracts.
Balance sheet netting does not include non-cash collateral
that we receive and pledge. For disclosure purposes, we present
the fair value of this non-cash collateral in the column titled
“Gross amounts not offset in consolidated balance sheet
(Disclosure-only netting)” within the table. We determine and
allocate the Disclosure-only netting amounts in the same
manner as balance sheet netting amounts.
The “Net amounts” column within the following table
represents the aggregate of our net exposure to each
counterparty after considering the balance sheet and Disclosure-
only netting adjustments. We manage derivative exposure by
monitoring the credit risk associated with each counterparty
206