Wells Fargo 2014 Annual Report Download - page 113
Download and view the complete annual report
Please find page 113 of the 2014 Wells Fargo annual report below. You can navigate through the pages in the report by either clicking on the pages listed below, or by using the keyword search tool below to find specific information within the annual report.-
 1
1 -
2
-
3
-
4
-
5
-
6
-
7
-
8
-
9
-
10
-
11
-
12
-
13
-
14
-
15
-
16
-
17
-
18
-
19
-
20
-
21
-
22
-
23
-
24
-
25
-
26
-
27
-
28
-
29
-
30
-
31
-
32
-
33
-
34
-
35
-
36
-
37
-
38
-
39
-
40
-
41
-
42
-
43
-
44
-
45
-
46
-
47
-
48
-
49
-
50
-
51
-
52
-
53
-
54
-
55
-
56
-
57
-
58
-
59
-
60
-
61
-
62
-
63
-
64
-
65
-
66
-
67
-
68
-
69
-
70
-
71
-
72
-
73
-
74
-
75
-
76
-
77
-
78
-
79
-
80
-
81
-
82
-
83
-
84
-
85
-
86
-
87
-
88
-
89
-
90
-
91
-
92
-
93
-
94
-
95
-
96
-
97
-
98
-
99
-
100
-
101
-
102
-
 103
103 -
 104
104 -
 105
105 -
 106
106 -
 107
107 -
 108
108 -
 109
109 -
 110
110 -
 111
111 -
 112
112 -
 113
113 -
 114
114 -
 115
115 -
 116
116 -
 117
117 -
 118
118 -
 119
119 -
 120
120 -
 121
121 -
 122
122 -
 123
123 -
124
-
125
-
126
-
127
-
128
-
129
-
130
-
131
-
132
-
133
-
134
-
135
-
136
-
137
-
138
-
139
-
140
-
141
-
142
-
143
-
144
-
145
-
146
-
147
-
148
-
149
-
150
-
151
-
152
-
153
-
154
-
155
-
156
-
157
-
158
-
159
-
160
-
161
-
162
-
163
-
164
-
165
-
166
-
167
-
168
-
169
-
170
-
171
-
172
-
173
-
174
-
175
-
176
-
177
-
178
-
179
-
180
-
181
-
182
-
183
-
184
-
185
-
186
-
187
-
188
-
189
-
190
-
191
-
192
-
193
-
194
-
195
-
196
-
197
-
198
-
199
-
200
-
201
-
202
-
203
-
204
-
205
-
206
-
207
-
208
-
209
-
210
-
211
-
212
-
213
-
214
-
215
-
216
-
217
-
218
-
219
-
220
-
221
-
222
-
223
-
224
-
225
-
226
-
227
-
228
-
229
-
230
-
231
-
232
-
233
-
234
-
235
-
236
-
237
-
238
-
239
-
240
-
241
-
242
-
243
-
244
-
245
-
246
-
247
-
248
-
249
-
250
-
251
-
252
-
253
-
254
-
255
-
256
-
257
-
258
-
259
-
260
-
261
-
262
-
263
-
264
-
265
-
266
-
267
-
268
 |
 |

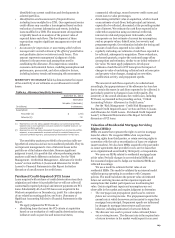
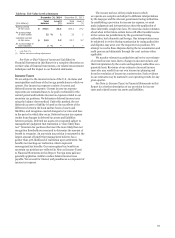
Table 65: Fair Value Level 3 Summary
December 31, 2014 December 31, 2013
($ in billions) Total
balance Level 3
(1) Total
balance Level 3
(1)
Assets carried
at fair value $ 378.1 32.3 353.1 37.2
As a percentage
of total assets 22 % 2 23 2
Liabilities carried
at fair value $ 34.9 2.3 22.7 3.7
As a percentage of
total liabilities 2 % * 2 *
* Less than 1%.
(1) Before derivative netting adjustments.
See Note 17 (Fair Values of Assets and Liabilities) to
Financial Statements in this Report for a complete discussion on
our fair value of financial instruments, our related measurement
techniques and the impact to our financial statements.
Income Taxes
We are subject to the income tax laws of the U.S., its states and
municipalities and those of the foreign jurisdictions in which we
operate. Our income tax expense consists of current and
deferred income tax expense. Current income tax expense
represents our estimated taxes to be paid or refunded for the
current period and includes income tax expense related to our
uncertain tax positions. We determine deferred income taxes
using the balance sheet method. Under this method, the net
deferred tax asset or liability is based on the tax effects of the
differences between the book and tax bases of assets and
liabilities, and recognizes enacted changes in tax rates and laws
in the period in which they occur. Deferred income tax expense
results from changes in deferred tax assets and liabilities
between periods. Deferred tax assets are recognized subject to
management’s judgment that realization is “more likely than
not.” Uncertain tax positions that meet the more likely than not
recognition threshold are measured to determine the amount of
benefit to recognize. An uncertain tax position is measured at the
largest amount of benefit that management believes has a
greater than 50% likelihood of realization upon settlement. Tax
benefits not meeting our realization criteria represent
unrecognized tax benefits. Our unrecognized tax benefits on
uncertain tax positions are reflected in Note 21 (Income Taxes)
to Financial Statements in this Report. Foreign taxes paid are
generally applied as credits to reduce federal income taxes
payable. We account for interest and penalties as a component of
income tax expense.
The income tax laws of the jurisdictions in which
we operate are complex and subject to different interpretations
by the taxpayer and the relevant government taxing authorities.
In establishing a provision for income tax expense, we must
make judgments and interpretations about the application of
these inherently complex tax laws. We must also make estimates
about when in the future certain items will affect taxable income
in the various tax jurisdictions by the government taxing
authorities, both domestic and foreign. Our interpretations may
be subjected to review during examination by taxing authorities
and disputes may arise over the respective tax positions. We
attempt to resolve these disputes during the tax examination and
audit process and ultimately through the court systems when
applicable.
We monitor relevant tax authorities and revise our estimate
of accrued income taxes due to changes in income tax laws and
their interpretation by the courts and regulatory authorities on a
quarterly basis. Revisions of our estimate of accrued income
taxes also may result from our own income tax planning and
from the resolution of income tax controversies. Such revisions
in our estimates may be material to our operating results for any
given quarter.
See Note 21 (Income Taxes) to Financial Statements in this
Report for a further description of our provision for income
taxes and related income tax assets and liabilities.
111