Wells Fargo 2014 Annual Report Download - page 67
Download and view the complete annual report
Please find page 67 of the 2014 Wells Fargo annual report below. You can navigate through the pages in the report by either clicking on the pages listed below, or by using the keyword search tool below to find specific information within the annual report.-
 1
1 -
2
-
3
-
4
-
5
-
6
-
7
-
8
-
9
-
10
-
11
-
12
-
13
-
14
-
15
-
16
-
17
-
18
-
19
-
20
-
21
-
22
-
23
-
24
-
25
-
26
-
27
-
28
-
29
-
30
-
31
-
32
-
33
-
34
-
35
-
36
-
37
-
38
-
39
-
40
-
41
-
42
-
43
-
44
-
45
-
46
-
47
-
48
-
49
-
50
-
51
-
52
-
53
-
54
-
55
-
56
-
 57
57 -
 58
58 -
 59
59 -
 60
60 -
 61
61 -
 62
62 -
 63
63 -
 64
64 -
 65
65 -
 66
66 -
 67
67 -
 68
68 -
 69
69 -
 70
70 -
 71
71 -
 72
72 -
 73
73 -
 74
74 -
 75
75 -
 76
76 -
 77
77 -
78
-
79
-
80
-
81
-
82
-
83
-
84
-
85
-
86
-
87
-
88
-
89
-
90
-
91
-
92
-
93
-
94
-
95
-
96
-
97
-
98
-
99
-
100
-
101
-
102
-
103
-
104
-
105
-
106
-
107
-
108
-
109
-
110
-
111
-
112
-
113
-
114
-
115
-
116
-
117
-
118
-
119
-
120
-
121
-
122
-
123
-
124
-
125
-
126
-
127
-
128
-
129
-
130
-
131
-
132
-
133
-
134
-
135
-
136
-
137
-
138
-
139
-
140
-
141
-
142
-
143
-
144
-
145
-
146
-
147
-
148
-
149
-
150
-
151
-
152
-
153
-
154
-
155
-
156
-
157
-
158
-
159
-
160
-
161
-
162
-
163
-
164
-
165
-
166
-
167
-
168
-
169
-
170
-
171
-
172
-
173
-
174
-
175
-
176
-
177
-
178
-
179
-
180
-
181
-
182
-
183
-
184
-
185
-
186
-
187
-
188
-
189
-
190
-
191
-
192
-
193
-
194
-
195
-
196
-
197
-
198
-
199
-
200
-
201
-
202
-
203
-
204
-
205
-
206
-
207
-
208
-
209
-
210
-
211
-
212
-
213
-
214
-
215
-
216
-
217
-
218
-
219
-
220
-
221
-
222
-
223
-
224
-
225
-
226
-
227
-
228
-
229
-
230
-
231
-
232
-
233
-
234
-
235
-
236
-
237
-
238
-
239
-
240
-
241
-
242
-
243
-
244
-
245
-
246
-
247
-
248
-
249
-
250
-
251
-
252
-
253
-
254
-
255
-
256
-
257
-
258
-
259
-
260
-
261
-
262
-
263
-
264
-
265
-
266
-
267
-
268
 |
 |

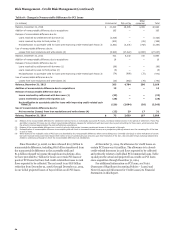
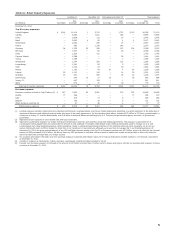
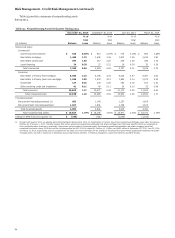
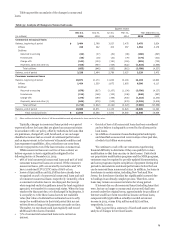
Table 22: Select Country Exposures
Lending (1) Securities (2) Derivatives and other (3) Total exposure
Non- Non- Non- Non-
(in millions) Sovereign sovereign Sovereign sovereign Sovereign sovereign Sovereign sovereign (4) Total
December 31, 2014
Top 20 country exposures:
United Kingdom $ 5,014 11,014 1 3,710 — 1,371 5,015 16,095 21,110
Canada — 8,283 — 1,251 — 365 — 9,899 9,899
China — 2,838 — 113 — 27 — 2,978 2,978
Brazil — 2,645 4 28 — 4 4 2,677 2,681
Netherlands — 2,262 — 268 — 37 — 2,567 2,567
France — 882 — 1,145 — 343 — 2,370 2,370
Germany 94 1,323 60 599 — 137 154 2,059 2,213
Bermuda — 1,937 — 65 — 26 — 2,028 2,028
India — 1,625 — 121 — — — 1,746 1,746
Cayman Islands — 1,588 — — — 26 — 1,614 1,614
Turkey — 1,588 — — — 1 — 1,589 1,589
Switzerland — 1,044 — 362 — 122 — 1,528 1,528
Luxembourg — 1,391 — 95 — 9 — 1,495 1,495
Chile — 1,426 — 23 — 33 — 1,482 1,482
Mexico — 1,192 — 43 67 4 67 1,239 1,306
Ireland 53 1,101 — 104 — 16 53 1,221 1,274
Australia 22 641 — 558 — 36 22 1,235 1,257
South Korea — 945 13 17 23 — 36 962 998
Jersey, C.I. — 647 — 193 — 1 — 841 841
Spain — 673 — 70 — 33 — 776 776
Total top 20 country exposures $ 5,183 45,045 78 8,765 90 2,591 5,351 56,401 61,752
Eurozone exposure:
Eurozone countries included in Top 20 above (5) $ 147 7,632 60 2,281 — 575 207 10,488 10,695
Austria 77 396 — — — — 77 396 473
Italy — 206 — 73 — 6 — 285 285
Belgium — 103 — 19 — 9 — 131 131
Other Eurozone countries (6) — 37 — 38 — 2 — 77 77
Total Eurozone exposure $ 224 8,374 60 2,411 — 592 284 11,377 11,661
(1) Lending exposure includes funded loans and unfunded commitments, leveraged leases, and money market placements presented on a gross basis prior to the deduction of
impairment allowance and collateral received under the terms of the credit agreements. For the countries listed above, includes $373 million in PCI loans, predominantly to
customers in Jersey, C.I. and the Netherlands, and $1.8 billion in defeased leases secured largely by U.S. Treasury and government agency securities, or government
guaranteed.
(2) Represents issuer exposure on cross-border debt and equity securities.
(3) Represents counterparty exposure on foreign exchange and derivative contracts, and securities resale and lending agreements. This exposure is presented net of
counterparty netting adjustments and reduced by the amount of cash collateral. It includes credit default swaps (CDS) predominantly used to manage our U.S. and
London-based cash credit trading businesses, which sometimes results in selling and purchasing protection on the identical reference entity. Generally, we do not use
market instruments such as CDS to hedge the credit risk of our investment or loan positions, although we do use them to manage risk in our trading businesses. At
December 31, 2014, the gross notional amount of our CDS sold that reference assets in the Top 20 or Eurozone countries was $3.3 billion, which was offset by the notional
amount of CDS purchased of $3.4 billion. We did not have any CDS purchased or sold that reference pools of assets that contain sovereign debt or where the reference
asset was solely the sovereign debt of a foreign country.
(4) For countries presented in the table, total non-sovereign exposure comprises $20.9 billion exposure to financial institutions and $36.4 billion to non-financial corporations
at December 31, 2014.
(5) Consists of exposure to Netherlands, France, Germany, Luxembourg, Ireland and Spain included in Top 20.
(6) Includes non-sovereign exposure to Portugal in the amount of $67 million and less than $1 million each to Greece and Cyprus. We had no sovereign debt exposure to these
countries at December 31, 2014.
65