Wells Fargo 2014 Annual Report Download - page 79
Download and view the complete annual report
Please find page 79 of the 2014 Wells Fargo annual report below. You can navigate through the pages in the report by either clicking on the pages listed below, or by using the keyword search tool below to find specific information within the annual report.-
 1
1 -
2
-
3
-
4
-
5
-
6
-
7
-
8
-
9
-
10
-
11
-
12
-
13
-
14
-
15
-
16
-
17
-
18
-
19
-
20
-
21
-
22
-
23
-
24
-
25
-
26
-
27
-
28
-
29
-
30
-
31
-
32
-
33
-
34
-
35
-
36
-
37
-
38
-
39
-
40
-
41
-
42
-
43
-
44
-
45
-
46
-
47
-
48
-
49
-
50
-
51
-
52
-
53
-
54
-
55
-
56
-
57
-
58
-
59
-
60
-
61
-
62
-
63
-
64
-
65
-
66
-
67
-
68
-
 69
69 -
 70
70 -
 71
71 -
 72
72 -
 73
73 -
 74
74 -
 75
75 -
 76
76 -
 77
77 -
 78
78 -
 79
79 -
 80
80 -
 81
81 -
 82
82 -
 83
83 -
 84
84 -
 85
85 -
 86
86 -
 87
87 -
 88
88 -
 89
89 -
90
-
91
-
92
-
93
-
94
-
95
-
96
-
97
-
98
-
99
-
100
-
101
-
102
-
103
-
104
-
105
-
106
-
107
-
108
-
109
-
110
-
111
-
112
-
113
-
114
-
115
-
116
-
117
-
118
-
119
-
120
-
121
-
122
-
123
-
124
-
125
-
126
-
127
-
128
-
129
-
130
-
131
-
132
-
133
-
134
-
135
-
136
-
137
-
138
-
139
-
140
-
141
-
142
-
143
-
144
-
145
-
146
-
147
-
148
-
149
-
150
-
151
-
152
-
153
-
154
-
155
-
156
-
157
-
158
-
159
-
160
-
161
-
162
-
163
-
164
-
165
-
166
-
167
-
168
-
169
-
170
-
171
-
172
-
173
-
174
-
175
-
176
-
177
-
178
-
179
-
180
-
181
-
182
-
183
-
184
-
185
-
186
-
187
-
188
-
189
-
190
-
191
-
192
-
193
-
194
-
195
-
196
-
197
-
198
-
199
-
200
-
201
-
202
-
203
-
204
-
205
-
206
-
207
-
208
-
209
-
210
-
211
-
212
-
213
-
214
-
215
-
216
-
217
-
218
-
219
-
220
-
221
-
222
-
223
-
224
-
225
-
226
-
227
-
228
-
229
-
230
-
231
-
232
-
233
-
234
-
235
-
236
-
237
-
238
-
239
-
240
-
241
-
242
-
243
-
244
-
245
-
246
-
247
-
248
-
249
-
250
-
251
-
252
-
253
-
254
-
255
-
256
-
257
-
258
-
259
-
260
-
261
-
262
-
263
-
264
-
265
-
266
-
267
-
268
 |
 |

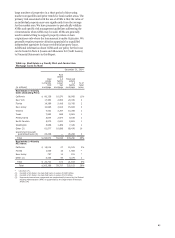
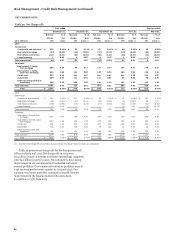
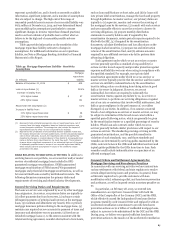
TROUBLED DEBT RESTRUCTURINGS (TDRs)
Table 35: Troubled Debt Restructurings (TDRs)
December 31,
(in millions) 2014 2013 2012 2011 2010
Commercial TDRs
Commercial and industrial $ 724 1,034 1,700 2,046 619
Real estate mortgage 1,880 2,248 2,625 2,262 725
Real estate construction 314 475 801 1,008 407
Lease financing 2 8 20 33 —
Total commercial TDRs 2,920 3,765 5,146 5,349 1,751
Consumer TDRs
Real estate 1-4 family first mortgage 18,226 18,925 17,804 13,799 11,603
Real estate 1-4 family junior lien mortgage 2,437 2,468 2,390 1,986 1,626
Credit Card 338 431 531 593 548
Automobile 127 189 314 260 214
Other revolving credit and installment 49 33 24 19 16
Trial modifications 452 650 705 651 —
Total consumer TDRs (1) 21,629 22,696 21,768 17,308 14,007
Total TDRs $ 24,549 26,461 26,914 22,657 15,758
TDRs on nonaccrual status $ 7,104 8,172 10,149 6,811 5,185
TDRs on accrual status (1) 17,445 18,289 16,765 15,846 10,573
Total TDRs $ 24,549 26,461 26,914 22,657 15,758
(1) TDR loans include $2.1 billion, $2.5 billion, $1.9 billion, $318 million, and $429 million at December 31, 2014, 2013, 2012, 2011, and 2010, respectively, of government
insured/guaranteed loans that are predominantly insured by the FHA or guaranteed by the VA and are accruing.
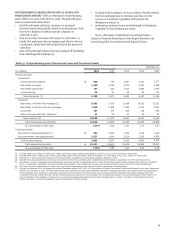
Table 36: TDRs Balance by Quarter During 2014
Dec 31, Sep 30, Jun 30, Mar 31,
(in millions) 2014 2014 2014 2014
Commercial TDRs
Commercial and industrial $ 724 836 950 1,088
Real estate mortgage 1,880 2,034 2,179 2,233
Real estate construction 314 328 391 454
Lease financing 2 3 5 6
Total commercial TDRs 2,920 3,201 3,525 3,781
Consumer TDRs
Real estate 1-4 family first mortgage 18,226 18,366 18,582 19,043
Real estate 1-4 family junior lien mortgage 2,437 2,464 2,463 2,460
Credit Card 338 358 379 399
Automobile 127 135 151 169
Other revolving credit and installment 49 45 38 34
Trial modifications 452 473 469 593
Total consumer TDRs 21,629 21,841 22,082 22,698
Total TDRs $ 24,549 25,042 25,607 26,479
TDRs on nonaccrual status $ 7,104 7,313 7,638 7,774
TDRs on accrual status 17,445 17,729 17,969 18,705
Total TDRs $ 24,549 25,042 25,607 26,479
Table 35 and Table 36 provide information regarding the
recorded investment of loans modified in TDRs. The allowance
for loan losses for TDRs was $3.6 billion and $4.5 billion at
December 31, 2014 and 2013, respectively. See Note 6 (Loans
and Allowance for Credit Losses) to Financial Statements in this
Report for additional information regarding TDRs. In those
situations where principal is forgiven, the entire amount of such
forgiveness is immediately charged off to the extent not done so
prior to the modification. We sometimes delay the timing on the
repayment of a portion of principal (principal forbearance) and
charge off the amount of forbearance if that amount is not
considered fully collectible.
Our nonaccrual policies are generally the same for all loan
types when a restructuring is involved. We re-underwrite loans
at the time of restructuring to determine whether there is
sufficient evidence of sustained repayment capacity based on the
borrower’s documented income, debt to income ratios, and other
factors. Loans lacking sufficient evidence of sustained repayment
77