Wells Fargo 2014 Annual Report Download - page 76
Download and view the complete annual report
Please find page 76 of the 2014 Wells Fargo annual report below. You can navigate through the pages in the report by either clicking on the pages listed below, or by using the keyword search tool below to find specific information within the annual report.-
 1
1 -
2
-
3
-
4
-
5
-
6
-
7
-
8
-
9
-
10
-
11
-
12
-
13
-
14
-
15
-
16
-
17
-
18
-
19
-
20
-
21
-
22
-
23
-
24
-
25
-
26
-
27
-
28
-
29
-
30
-
31
-
32
-
33
-
34
-
35
-
36
-
37
-
38
-
39
-
40
-
41
-
42
-
43
-
44
-
45
-
46
-
47
-
48
-
49
-
50
-
51
-
52
-
53
-
54
-
55
-
56
-
57
-
58
-
59
-
60
-
61
-
62
-
63
-
64
-
65
-
 66
66 -
 67
67 -
 68
68 -
 69
69 -
 70
70 -
 71
71 -
 72
72 -
 73
73 -
 74
74 -
 75
75 -
 76
76 -
 77
77 -
 78
78 -
 79
79 -
 80
80 -
 81
81 -
 82
82 -
 83
83 -
 84
84 -
 85
85 -
 86
86 -
87
-
88
-
89
-
90
-
91
-
92
-
93
-
94
-
95
-
96
-
97
-
98
-
99
-
100
-
101
-
102
-
103
-
104
-
105
-
106
-
107
-
108
-
109
-
110
-
111
-
112
-
113
-
114
-
115
-
116
-
117
-
118
-
119
-
120
-
121
-
122
-
123
-
124
-
125
-
126
-
127
-
128
-
129
-
130
-
131
-
132
-
133
-
134
-
135
-
136
-
137
-
138
-
139
-
140
-
141
-
142
-
143
-
144
-
145
-
146
-
147
-
148
-
149
-
150
-
151
-
152
-
153
-
154
-
155
-
156
-
157
-
158
-
159
-
160
-
161
-
162
-
163
-
164
-
165
-
166
-
167
-
168
-
169
-
170
-
171
-
172
-
173
-
174
-
175
-
176
-
177
-
178
-
179
-
180
-
181
-
182
-
183
-
184
-
185
-
186
-
187
-
188
-
189
-
190
-
191
-
192
-
193
-
194
-
195
-
196
-
197
-
198
-
199
-
200
-
201
-
202
-
203
-
204
-
205
-
206
-
207
-
208
-
209
-
210
-
211
-
212
-
213
-
214
-
215
-
216
-
217
-
218
-
219
-
220
-
221
-
222
-
223
-
224
-
225
-
226
-
227
-
228
-
229
-
230
-
231
-
232
-
233
-
234
-
235
-
236
-
237
-
238
-
239
-
240
-
241
-
242
-
243
-
244
-
245
-
246
-
247
-
248
-
249
-
250
-
251
-
252
-
253
-
254
-
255
-
256
-
257
-
258
-
259
-
260
-
261
-
262
-
263
-
264
-
265
-
266
-
267
-
268
 |
 |

Risk Management - Credit Risk Management (continued)
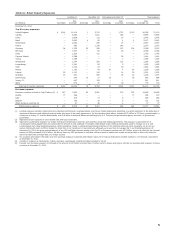
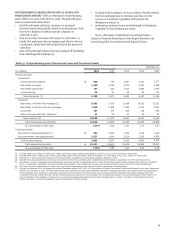
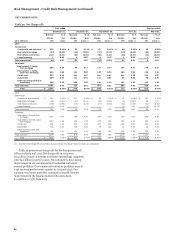
Table 32 provides a summary of nonperforming assets
during 2014.
Table 32: Nonperforming Assets by Quarter During 2014
December 31, 2014 September 30, 2014 June 30, 2014 March 31, 2014
% of % of % of % of
total total total total
(in millions) Balance loans Balance loans Balance loans Balance loans
Nonaccrual loans:
Commercial:
Commercial and industrial $ 538 0.20% $ 614 0.24% $ 724 0.29% $ 664 0.28%
Real estate mortgage 1,490 1.33 1,636 1.46 1,805 1.59 2,034 1.80
Real estate construction 187 1.00 217 1.20 239 1.38 296 1.76
Lease financing 24 0.20 27 0.22 29 0.24 32 0.26
Total commercial 2,239 0.54 2,494 0.63 2,797 0.71 3,026 0.79
Consumer:
Real estate 1-4 family first mortgage 8,583 3.23 8,785 3.34 9,026 3.47 9,357 3.61
Real estate 1-4 family junior lien mortgage 1,848 3.09 1,903 3.13 1,965 3.14 2,073 3.24
Automobile 137 0.25 143 0.26 150 0.28 161 0.31
Other revolving credit and installment 41 0.11 40 0.11 34 0.10 33 0.08
Total consumer 10,609 2.37 10,871 2.46 11,175 2.55 11,624 2.61
Total nonaccrual loans 12,848 1.49 13,365 1.59 13,972 1.69 14,650 1.77
Foreclosed assets:
Government insured/guaranteed (1) 982 1,140 1,257 1,609
Non-government insured/guaranteed 1,627 1,691 1,748 1,813
Total foreclosed assets 2,609 2,831 3,005 3,422
Total nonperforming assets $ 15,457 1.79% $ 16,196 1.93% $ 16,977 2.05% $ 18,072 2.19%
Change in NPAs from prior quarter (1) $ (739) (781) (1,095) (1,533)
(1) During fourth quarter 2014, we adopted Accounting Standards Update (ASU) 2014-14, Classification of Certain Government-Guaranteed Mortgage Loans Upon Foreclosure,
effective as of January 1, 2014. This ASU requires that certain government guaranteed residential real estate mortgage loans that meet specific criteria be recognized as
other receivables upon foreclosure; previously, these assets were included in foreclosed assets. Government guaranteed residential real estate mortgage loans that
completed foreclosure during 2014 and met the criteria specified by ASU 2014-14 totaled $1.5 billion, $1.1 billion, and $693 million at September 30, 2014, June 30, 2014,
and March 31, 2014, respectively, and are excluded from this table. For more information on the changes in foreclosures for government guaranteed residential real estate
mortgage loans, see Note 1 (Summary of Significant Accounting Policies) and Note 7 (Premises, Equipment, Lease Commitments and Other Assets).
74