Wells Fargo 2014 Annual Report Download - page 136
Download and view the complete annual report
Please find page 136 of the 2014 Wells Fargo annual report below. You can navigate through the pages in the report by either clicking on the pages listed below, or by using the keyword search tool below to find specific information within the annual report.-
 1
1 -
2
-
3
-
4
-
5
-
6
-
7
-
8
-
9
-
10
-
11
-
12
-
13
-
14
-
15
-
16
-
17
-
18
-
19
-
20
-
21
-
22
-
23
-
24
-
25
-
26
-
27
-
28
-
29
-
30
-
31
-
32
-
33
-
34
-
35
-
36
-
37
-
38
-
39
-
40
-
41
-
42
-
43
-
44
-
45
-
46
-
47
-
48
-
49
-
50
-
51
-
52
-
53
-
54
-
55
-
56
-
57
-
58
-
59
-
60
-
61
-
62
-
63
-
64
-
65
-
66
-
67
-
68
-
69
-
70
-
71
-
72
-
73
-
74
-
75
-
76
-
77
-
78
-
79
-
80
-
81
-
82
-
83
-
84
-
85
-
86
-
87
-
88
-
89
-
90
-
91
-
92
-
93
-
94
-
95
-
96
-
97
-
98
-
99
-
100
-
101
-
102
-
103
-
104
-
105
-
106
-
107
-
108
-
109
-
110
-
111
-
112
-
113
-
114
-
115
-
116
-
117
-
118
-
119
-
120
-
121
-
122
-
123
-
124
-
125
-
 126
126 -
 127
127 -
 128
128 -
 129
129 -
 130
130 -
 131
131 -
 132
132 -
 133
133 -
 134
134 -
 135
135 -
 136
136 -
 137
137 -
 138
138 -
 139
139 -
 140
140 -
 141
141 -
 142
142 -
 143
143 -
 144
144 -
 145
145 -
 146
146 -
147
-
148
-
149
-
150
-
151
-
152
-
153
-
154
-
155
-
156
-
157
-
158
-
159
-
160
-
161
-
162
-
163
-
164
-
165
-
166
-
167
-
168
-
169
-
170
-
171
-
172
-
173
-
174
-
175
-
176
-
177
-
178
-
179
-
180
-
181
-
182
-
183
-
184
-
185
-
186
-
187
-
188
-
189
-
190
-
191
-
192
-
193
-
194
-
195
-
196
-
197
-
198
-
199
-
200
-
201
-
202
-
203
-
204
-
205
-
206
-
207
-
208
-
209
-
210
-
211
-
212
-
213
-
214
-
215
-
216
-
217
-
218
-
219
-
220
-
221
-
222
-
223
-
224
-
225
-
226
-
227
-
228
-
229
-
230
-
231
-
232
-
233
-
234
-
235
-
236
-
237
-
238
-
239
-
240
-
241
-
242
-
243
-
244
-
245
-
246
-
247
-
248
-
249
-
250
-
251
-
252
-
253
-
254
-
255
-
256
-
257
-
258
-
259
-
260
-
261
-
262
-
263
-
264
-
265
-
266
-
267
-
268
 |
 |

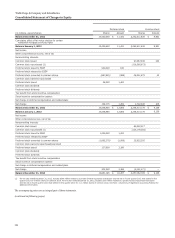
Wells Fargo & Company and Subsidiaries
Consolidated Statement of Changes in Equity
Preferred stock Common stock
(in millions, except shares) Shares Amount Shares Amount
Balance December 31, 2011 10,450,690 $ 11,431 5,262,611,636 $ 8,931
Cumulative effect of fair value election for certain
residential mortgage servicing rights
Balance January 1, 2012 10,450,690 11,431 5,262,611,636 8,931
Net income
Other comprehensive income, net of tax
Noncontrolling interests
Common stock issued 97,267,538 162
Common stock repurchased (1) (119,586,873)
Preferred stock issued to ESOP 940,000 940
Preferred stock released by ESOP
Preferred stock converted to common shares (887,825) (888) 26,021,875 43
Common stock warrants repurchased
Preferred stock issued 56,000 1,400
Common stock dividends
Preferred stock dividends
Tax benefit from stock incentive compensation
Stock incentive compensation expense
Net change in deferred compensation and related plans
Net change 108,175 1,452 3,702,540 205
Balance December 31, 2012 10,558,865 $ 12,883 5,266,314,176 $ 9,136
Balance January 1, 2013 10,558,865 12,883 5,266,314,176 9,136
Net income
Other comprehensive loss, net of tax
Noncontrolling interests
Common stock issued 89,392,517
Common stock repurchased (1) (124,179,383)
Preferred stock issued to ESOP 1,200,000 1,200
Preferred stock released by ESOP
Preferred stock converted to common shares (1,005,270) (1,006) 25,635,395
Common stock warrants repurchased/exercised
Preferred stock issued 127,600 3,190
Common stock dividends
Preferred stock dividends
Tax benefit from stock incentive compensation
Stock incentive compensation expense
Net change in deferred compensation and related plans
Net change 322,330 3,384 (9,151,471) —
Balance December 31, 2013 10,881,195 $ 16,267 5,257,162,705 $ 9,136
(1) For the year ended December 31, 2012, includes $200 million related to a private forward repurchase transaction entered into in fourth quarter 2012 that settled in first
quarter 2013 for 6 million shares of common stock. For the year ended December 31, 2013, includes $500 million related to a private forward repurchase transaction
entered into in fourth quarter 2013 that settled in first quarter 2014 for 11.1 million shares of common stock. See Note 1 (Summary of Significant Accounting Policies) for
additional information.
The accompanying notes are an integral part of these statements.
(continued on following pages)
134